Dashboard for Managing ABC Sales Analysis in Excel
ABC analysis is a proven method for prioritizing inventory or categorizing data based on importance. While the method itself is simple, presenting the results in a usable format can be challenging. That's where our interactive ABC dashboard template comes in. Built in Excel, this tool transforms raw data into clear, meaningful visualizations. Data visualization in interactive reports will enable you to make quicker, more effective, and well-informed business decisions.
ABC Analysis Dashboard Template in Excel
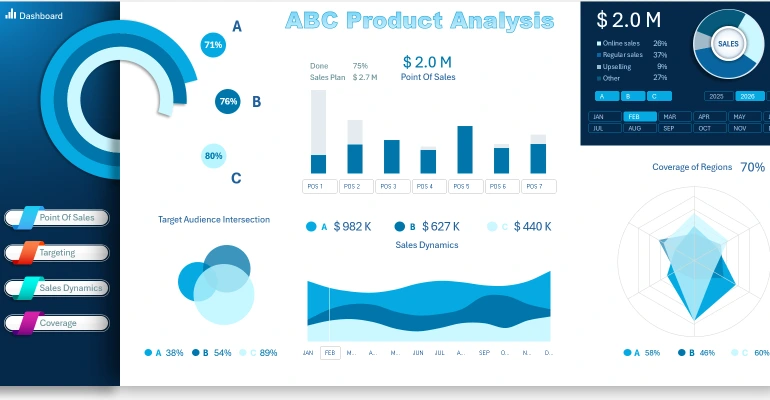
Here, you can download an Excel file with a ready-made solution for presenting an ABC analysis report. If you’d like to explore the dashboard interface in more detail, we recommend reading the article where all its visualization blocks and control elements are thoroughly explained.
ABC Sales Analysis of Various Product Categories in Excel Dashboard
In this article, you will learn:
- Why ABC analysis is critical for efficient resource management.
- How to use our template to simplify complex data.
- The main advantages of implementing an interactive dashboard compared to traditional methods.
- Master ABC analysis with our free interactive Excel dashboard template — no registration required.
Enhance your business efficiency. An example of ABC analysis data visualization on an elegant interactive dashboard developed in Excel. Learn how to save time, simplify decision-making, and gain valuable insights with our easy-to-use template.


Data Visualization Charts for Interactive Report Creation in Excel.
Dashboard Templates