Dynamic Weekly Chart Template in Excel Template
A weekly chart in Excel is a commonly used universal tool for visual performance monitoring. Thanks to interactive controls, the template dynamically updates when selecting a week for analysis.
Benefits of Using a Dynamic Weekly Chart in Excel
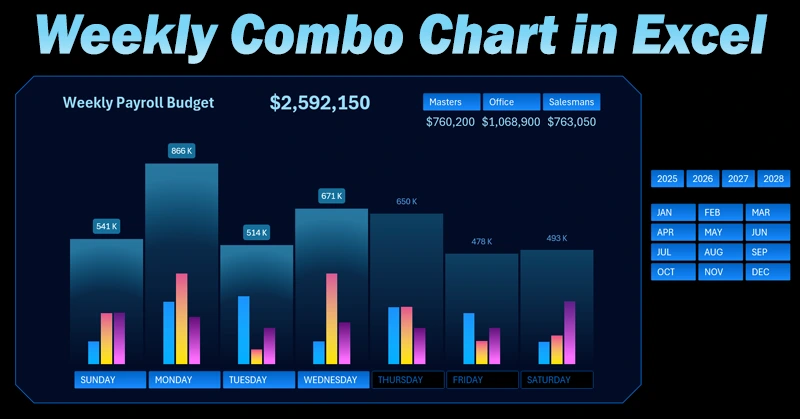
The weekly chart lets you select metrics not only by week but also by day of the week to get summary data. It supports multi-selection — allowing you to select multiple days or all days at once. Interactive features save time on analysis and enhance the presentation of data. To understand the structure and logic of the combined weekly chart built in Excel, we recommend watching the tutorial video, which covers the following topics:
- Base design for a combo chart using Excel shapes.
- Creating pivot tables to process source data.
- Filling the source data table with formulas for the combined Excel chart.
- Creating a dynamic weekly combo chart template in Excel.
- Adding toggle buttons to switch between weekdays, years, and months.
- Adding dynamic labels for financial indicators to enhance data visualization.
- Presentation on how to use the weekly combined chart in Excel.
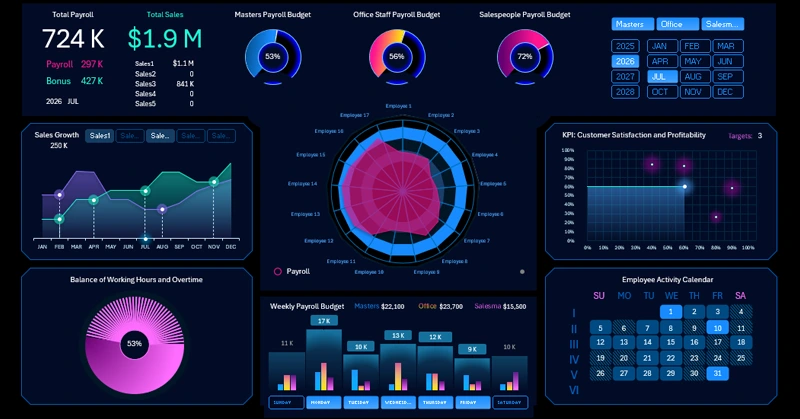
This ready-made template will help you quickly adapt the chart to your needs — whether it's work shifts, production metrics, team activity, or personal planning. See it in action with a live example from the Excel payroll analysis dashboard.
Follow these 3 simple steps:
- Step 1: Simply download the template.
- Step 2: Enter your data on the “Data” worksheet.
- Step 3: Press the shortcut CTRL + Alt + F5 to refresh all pivot tables.
Track changes in grouped performance metrics by weekday in a convenient interactive presentation format.


Data Visualization Charts for Interactive Report Creation in Excel.
Dashboard Templates