Growth Sales Point Tracker Chart in Excel Template
Analyzing sales growth points helps identify which directions and actions bring the most results for your company. With a ready-made Excel chart, you can clearly track trends, compare metrics, and find areas for scaling your sales volume.
Structure of the Chart for Analyzing Sales Growth Points in Excel
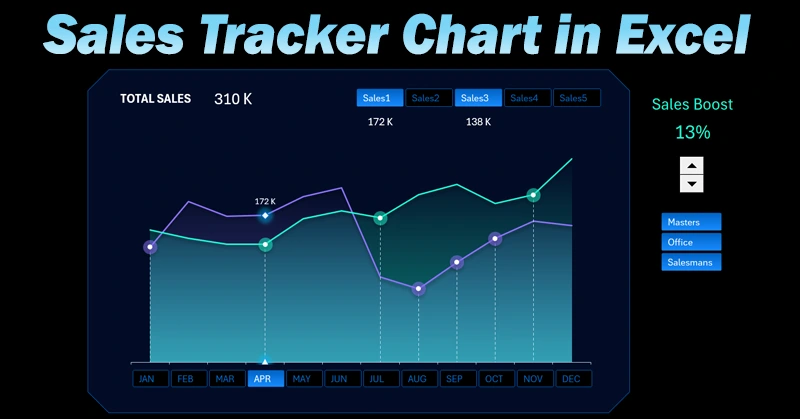
The ready-to-use Excel template saves time and lets you focus on what matters — making data-driven decisions. The training video will help you understand how to build dynamic charts for comparative analysis across different sales points. Video topics include:
- Base design using shapes for a dynamic sales chart in Excel.
- Formulas for auto-filling source data tables from an Excel sheet.
- Creating a combined chart template in Excel.
- Building interactive elements for tracking sales on the Excel chart.
- A control tool for managing boost points on the sales statistics chart.
- Comparative analysis of sales across multiple sales points on a single chart.
- Presentation of the sales growth point tracker in Excel.
How can you use the chart tracker to analyze sales growth in Excel? As a practical example of using dynamic combined charts, check out the interactive Excel dashboard for small business analysis.

Download the tracker, insert your own data, and get visual insights to boost revenue and improve sales performance.


Data Visualization Charts for Interactive Report Creation in Excel.
Dashboard Templates