Payroll Report Presentation Template in Excel Template
The payroll report is an important part of management reporting. To present the data clearly and visually, it’s best to use an interactive presentation with charts and graphs. You can download a ready-made presentation template for an interactive payroll report in Excel format.
What the Payroll Report Template in Excel Includes
To learn how to create such reports yourself, you can watch a tutorial video that walks through all the steps of building the template in Excel:
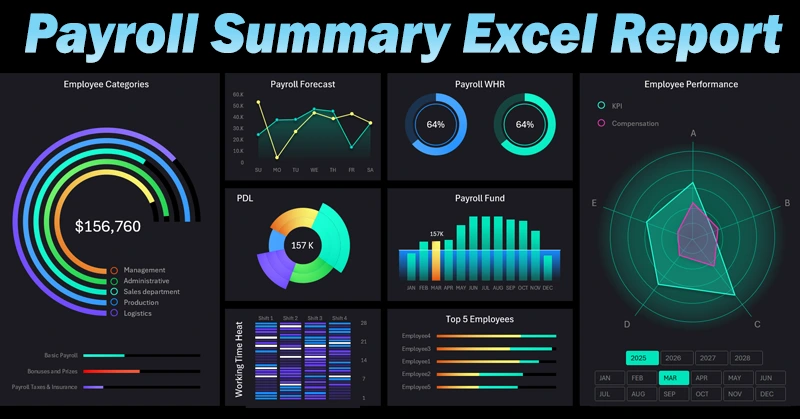
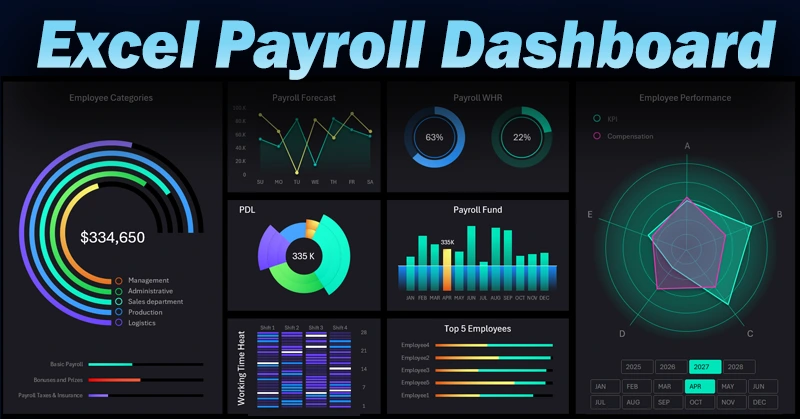
- Dashboard grid layout template.
- Employee categories – Management, Administrative Staff, Sales Department, Production Department, Logistics.
- Payroll structure – Base Salary, Bonuses and Incentives, Taxes and Insurance.
- Payroll forecast – Planned vs Actual.
- Payroll distribution by location – Headquarters, Regional Offices, Branches, Remote Employees, Outsourcing.
- Work Hours Representation (WHR) – Standard Hours, Actual Hours.
- Total Payroll – dynamic bar chart with a line indicator.
- Top 5 highest-paid employees – Salary and Bonus.
- Employee performance – KPIs and Compensation.
- Work time heatmap in Excel.
- Data labels, final touches, and fixing minor issues.
- Dashboard template presentation in Excel.
If you want to explore the business logic behind the dashboard in more detail, we recommend reading the detailed description of all visualization blocks:
Payroll Summary Report Template in Excel.
With this template, you can quickly gather key data, format the report as a presentation, and present information to management in a clear format. Just download the file, enter your figures on the “Data” sheet, refresh all pivot tables by pressing CTRL+ALT+F5 — and your presentation is ready.


Data Visualization Charts for Interactive Report Creation in Excel.
Dashboard Templates