Top 3 Beautiful Pie Chart Designs in Excel Template
Chart design plays an important role in how data is perceived in an Excel report presentation. Even a simple chart can look professional if you choose the right style and create a harmonious color palette. In this example, you’ll find 3 stylish chart design options in Excel that are suitable for reports, presentations, and dashboards.
Creative Chart Design Ideas for Excel Reports
MS Excel offers plenty of tools for creative data visualization design. You can apply gradient styles for fills, add shapes as background images, or even use them as part of the chart visualization itself. Download the ready-made template featuring three charts with unique and stylish designs to see Excel from a graphic designer’s perspective. The process of designing these chart styles is shown step-by-step in the video:
- How to create a new pie chart design in Excel for a visually appealing dashboard.
- Formulas for a dynamic doughnut chart that can display values above 100%.
- The first doughnut chart template with a beautiful and informative design over 100% in Excel.
- Setting up source data, creating smart and pivot tables, and adding interactive buttons.
- Creating a unique design for a dynamic pie chart in Excel.
- Using PowerPoint and its advanced shape editing features unavailable in Excel.
- Applying shape masking techniques on Excel charts.
- The second doughnut chart design template – Done!
- Formulas for creating the third chart template with a new design.
- Presentation of beautiful pie chart examples in Excel.
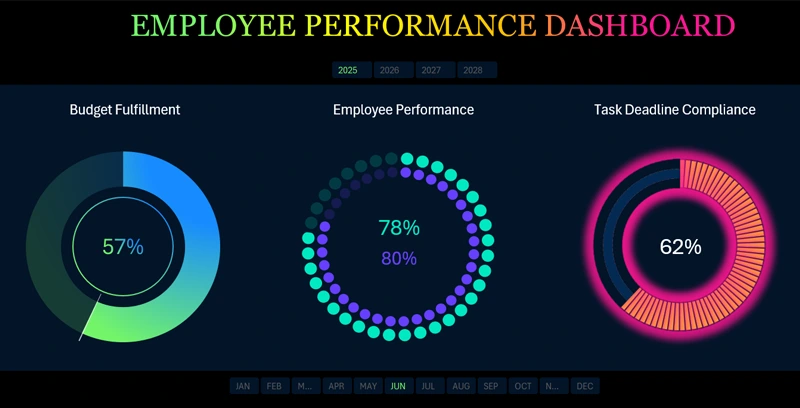
Where can you use such beautiful Pie Charts in practice? For example, in developing dashboard templates for data visualization in Excel:
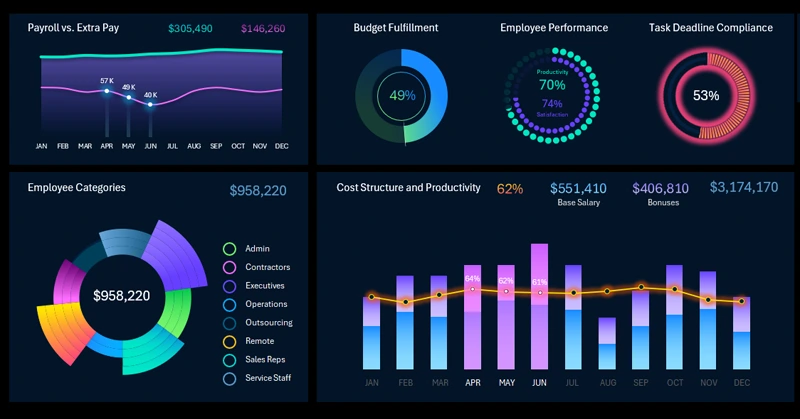
Interactive Employee Performance Report Example.
A functional chart design helps communicate insights faster and makes the report look more professional. Use these design options as templates for your projects and stand out with high-quality visualizations in the office.


Data Visualization Charts for Interactive Report Creation in Excel.
Dashboard Templates