Dynamic Excel Burndown Chart for Agile Project Management
In Agile project management, it is important to see not only the current workload but also the execution pace. A dynamic Burndown chart in Excel updates automatically based on actual data and allows you to quickly assess the project status.
How the dynamic Burndown chart works
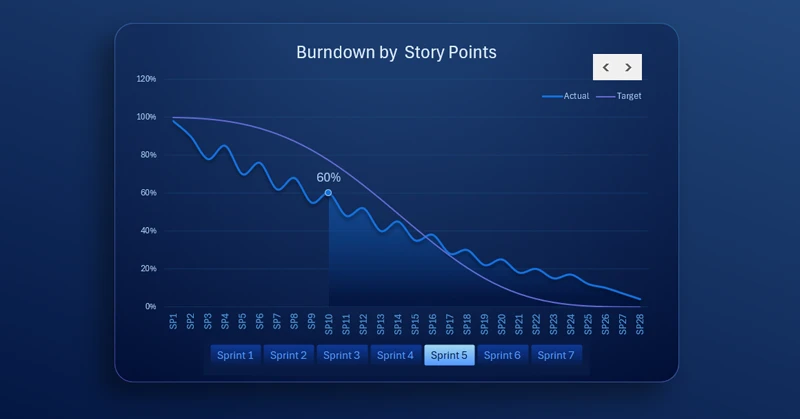
As shown in the image, the chart displays planned and actual burn lines with automatic recalculation of the remaining work.
The key feature of dynamic chart updates is that not only the markers within the visualization are refreshed, but the X and Y axis scale values are recalculated simultaneously. For example, the X-axis may initially display 12 divisions (e.g., 12 months), but after data changes, it may automatically adjust to 13, 24, or 8 divisions.
Benefits of using Excel for Agile analytics
In this example, the X-axis represents the number of tasks within a single sprint. In Agile project management methodology, the number of sprint tasks changes as new items are added. To enable this functionality in Excel, dynamic named ranges should be used in chart data arguments instead of traditional cell references. These named ranges contain formulas for working with variable cell arrays. As a result, the formula dynamically adjusts the number of cells referenced by the chart. This produces a highly dynamic Excel chart suitable for effective Agile project management.
See how these highly dynamic charts can be effectively used within a dashboard:
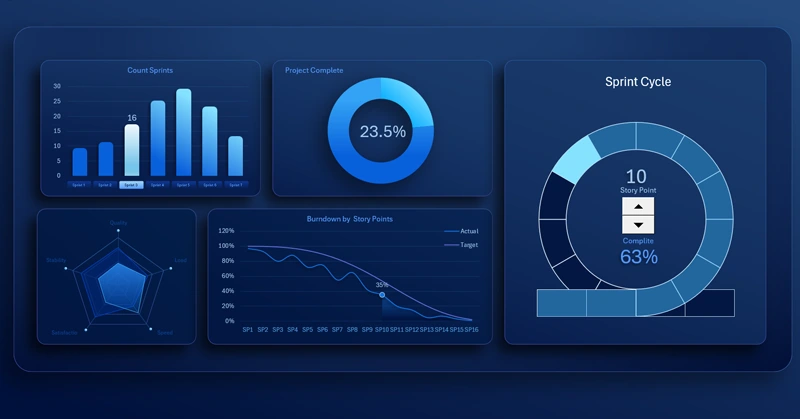
Agile project management template in interactive Excel dashboard format
The dynamic Burndown chart in Excel ensures transparency of sprint execution and helps identify risks of deviation from the plan in a timely manner. A dashboard built with this chart provides several advantages:
- Improves project controllability.
- Supports team discipline.
- Makes goal achievement more predictable and measurable.
You can learn how to build highly dynamic charts based on named ranges using our video tutorials:


Data Visualization Charts for Interactive Report Creation in Excel.
Dashboard Templates