Dynamic Sales Funnel in Excel for conversion analysis
The sales funnel is a central element of CRM analytics, allowing you to track the customer journey from the first contact to deal closure. In Excel, this type of visualization enables users to independently configure and structure conversion stages based on their specific business conditions and needs. You just need to learn how to build such dynamic funnels in Excel. This template was created for that purpose.
Why It Is Important to Learn How to Build Sales Funnels in Excel
Every entrepreneur needs to evaluate marketing and sales effectiveness in a timely manner, as well as identify points where opportunities are lost during the process. This makes the funnel a key tool for making informed decisions. That is why it is essential for every Excel user to learn how to build their own sales funnels.
This method of data visualization will never become obsolete. The principles of the sales funnel are based on fundamental mechanisms of the world—where 20 percent of efforts generate 80 percent of the results. This reflects the natural distribution of outcomes. It is surprising that Excel developers did not include a sales funnel chart in the standard set of tools. Previously, we have published different approaches to building interactive funnel charts in Excel. Review another template in the example file at the end of the article.
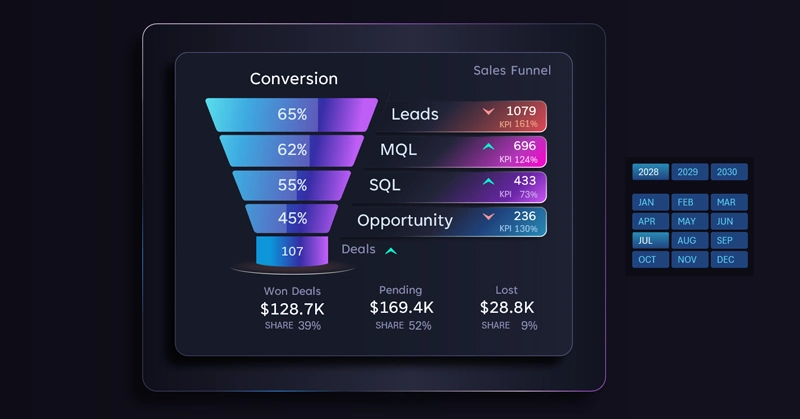
As usual, the package includes a training video for building the chart, as well as a dashboard for practical application of the visualization block. Take a look at this example, where it is подробно explained how to analyze conversion and sales effectiveness using a funnel in Excel:
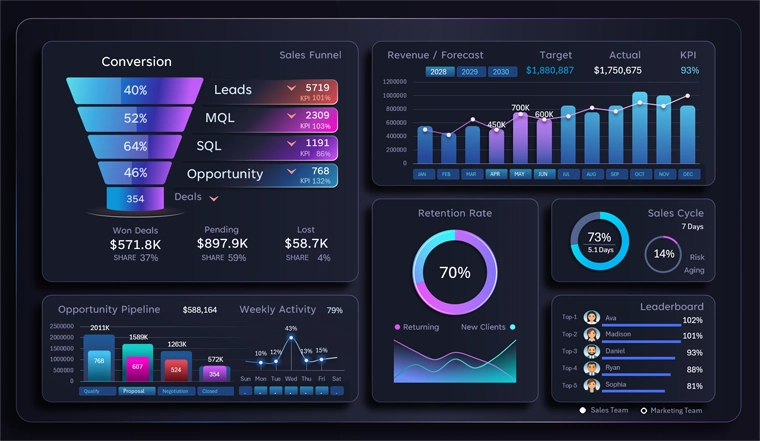
Using a sales funnel in Excel on a dashboard for CRM reporting
Using a sales funnel in Excel allows you to comprehensively evaluate lead performance at each stage. Tracking conversion rates, deal volume, and statuses helps identify weak points and optimize customer interaction strategies. As a result, companies gain a transparent sales management system focused on revenue growth and improved business process efficiency. The value of such a chart is hard to overestimate.
 Download the sales funnel chart template for conversion analysis in Excel

Data Visualization Charts for Interactive Report Creation in Excel.
Dashboard Templates