Excel Agile Project Management Dashboard for Development
The Excel dashboard for Agile project management in personal finance applications provides clarity and control for development teams working on financial technology projects. The dashboard template is designed for startups and small businesses. This template helps align budgets, sprints, and key milestones while keeping personal finance app development on track with a consistent workflow.
The Excel dashboard for Agile project management in personal finance applications provides clarity and control for development teams working on financial technology projects. The dashboard template is designed for startups and small businesses. This template helps align budgets, sprints, and key milestones while keeping personal finance app development on track with a consistent workflow.
Dashboard structure for app development management
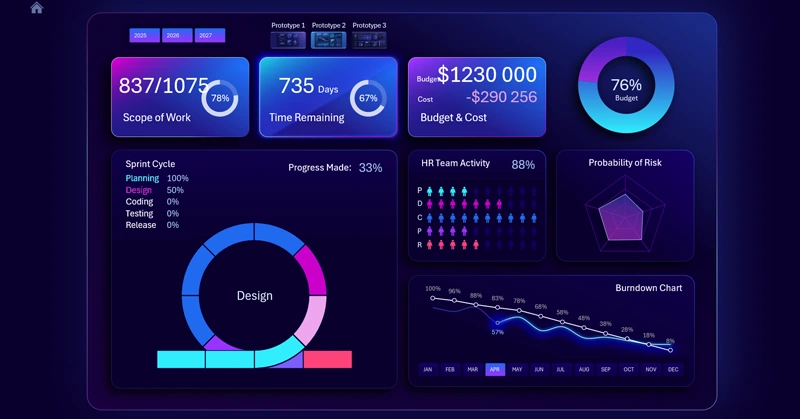
A project management dashboard template for personal finance app development. Track tasks, budgets, and milestones with a clear template optimized for Agile techniques and methodologies. You can download the ready-to-use template and also watch a tutorial video on how to build such dashboards in Excel. The video tutorial consists of two parts. The first part focuses on development stages:
- Creating the background.
- Designing the base with gradient shapes and soft shadows.
- Building the dashboard grid.
- KPI cards with glass neon design.
- Adding 3D blocks for dashboard visualization elements.
- Setting up source data and pivot tables in Excel.
- Formula table for building an interactive Burndown Chart.
- Adding controls using slicer buttons for pivot tables.
- How to build a visually appealing Burndown Chart in Excel for Agile project management.
- Modern design for dashboard slicer buttons.
- Risk probability chart visualization.
- Radar chart for budget expense structure by main categories.
- Bar chart with cursor for monthly expense visualization.
- Budget usage chart showing project allocation.
- Formulas for HR activity histogram.
- How to create a Human Resources chart in Excel.
- Using PowerPoint editor for a stylish HR chart in Excel.
- How to create an interactive Agile sprint cycle in Excel.
- Main chart for Agile project management.
- Adding dynamic data labels to KPI cards.
- Testing Agile project management dashboard presentation in Excel.
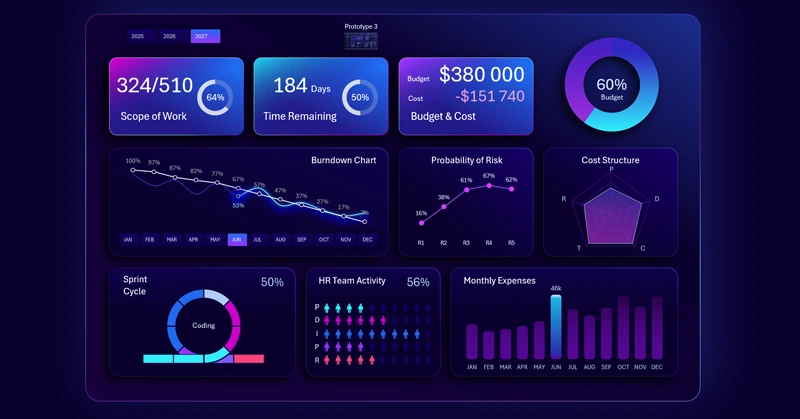
The second part of the Excel dashboard development tutorial includes:
- Dashboard foundation for the first screen – Burndown Chart.
- Menu buttons with highlights styled as KPI cards.
- Grid blocks for dashboard layout.
- How to make a Burndown Chart for Agile project management in Excel.
- Risk probability visualization chart.
- Radar chart for analyzing project team activity levels.
- Bar chart of monthly project management expenses.
- Progress chart showing budget consumption.
- Dynamic data labels with formulas for KPI cards.
- Creating a menu to switch between personal finance app prototypes.
- Designing a Sprint Cycle screen for Agile project management in Excel.
- How to make an interactive Sprint Cycle in Excel.
- How to use PowerPoint to create an HR histogram in Excel.
- Radar chart for analyzing budget expense structure.
- How to create menu buttons for switching between Excel sheets without macros.
- Dashboard presentation for continuous personal finance app development projects.
To explore the principles of data visualization on the dashboard and understand its practical use, we recommend checking the detailed guide:
Dashboard for Agile project management in personal finance app development.
By choosing the Excel Agile project management dashboard for app development, users get a structured, accessible, and ready-to-use tool for achieving Agile success. This template ensures transparency, improves team collaboration, and accelerates project delivery in the personal finance app market.


Data Visualization Charts for Interactive Report Creation in Excel.
Dashboard Templates