Excel Budget Segmentation Chart by expenses and income
Budgeting is the best method for managing personal finances. Budget segmentation is the key to conscious control for both personal and corporate finances. A multi-layered chart in Excel helps track how budget categories of expenses or income increase and decrease. It allows you to quickly identify priority spending areas so you can start managing the most influential source first.
Template for Budget Distribution Chart by Category
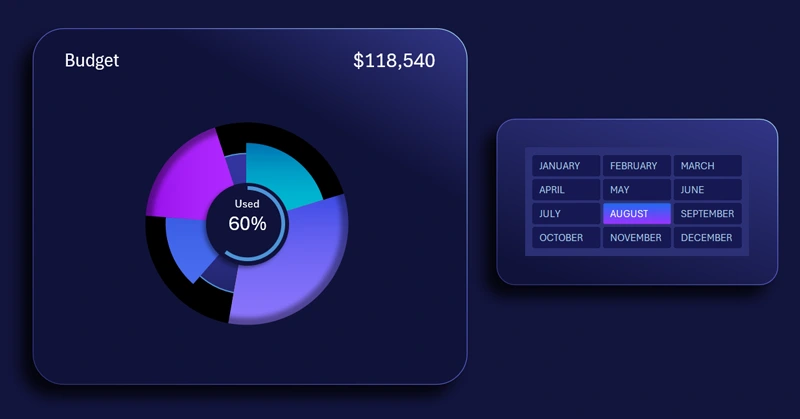
This template shows how to build an interactive chart that makes visual analysis of the budget structure simple and clear for any user level. Download the ready-to-use template at the end of the article! Even better — learn how to independently create interactive and multi-layered charts for data segmentation by category in Excel. The tutorial video will show you:
- Source formula table for building the chart template.
- How to create a donut chart and make it multi-layered.
- Setting up the color design of the chart petals on different layers.
- Creating a visualization block base using shapes.
- Decorating the chart with shapes on the lower and upper layers.
- Adding shadows to create depth and volume.
- Adding a chart control element using a data slicer.
- Testing the multi-layered chart in Excel.
This data visualization template is effectively used in a full-featured dashboard. It even has its own dedicated screen:
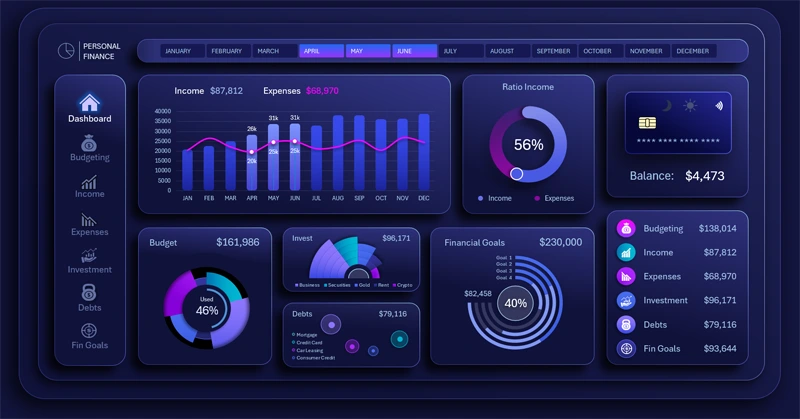
Personal finance budget dashboard in Excel
The budget segmentation chart makes financial data transparent and manageable. It helps easily identify spending imbalances and make fact-based decisions. Use this visualization to plan your budget more accurately and reach your financial goals faster.


Data Visualization Charts for Interactive Report Creation in Excel.
Dashboard Templates