Excel Dashboard for Team Engagement Dynamics
Employee engagement directly impacts task execution speed and overall project quality. An engagement dynamics dashboard allows you to visualize team activity levels, identify trends, and respond promptly to declines in participation.
Engagement metrics and indicators in a project environment
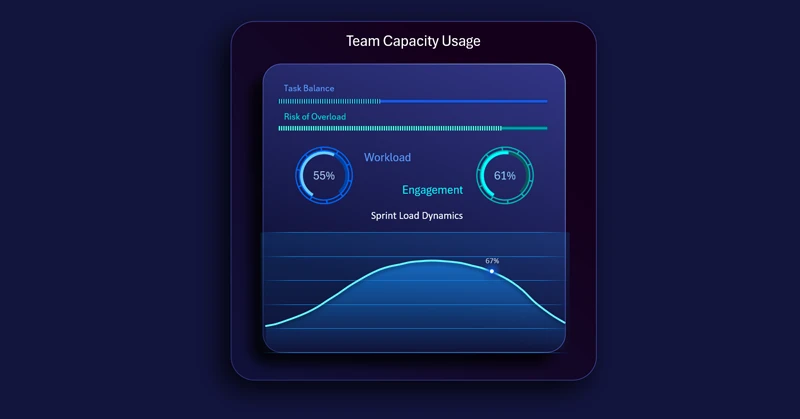
Employee activity charts demonstrate changes in participation levels and the distribution of contributions across project stages. Users can track current team workload and resource utilization dynamics within Agile sprints.
The employee engagement dynamics dashboard transforms scattered activity data into a structured monitoring system. Notice how this visualization block can be effectively integrated into a larger dashboard designed for Agile project management in Excel:
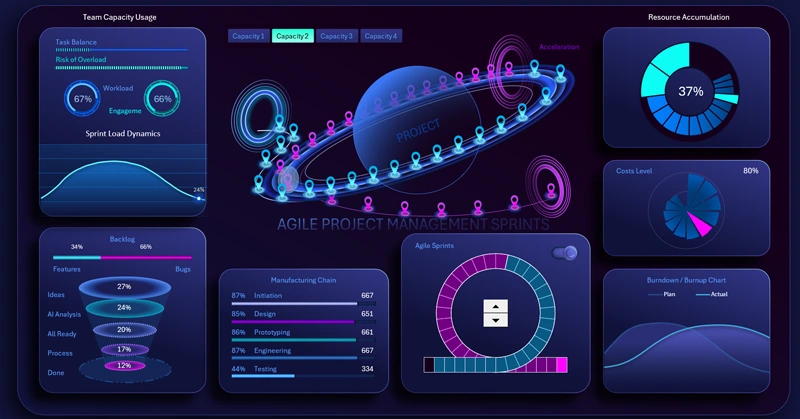
Download the interactive Sprint Circle dashboard in Excel
This template helps leaders and managers to:
- Make data-driven decisions.
- Maintain team motivation.
- Ensure sustainable project progress through transparency and timely analytics.
Watch the video tutorial to learn how to build a mini dashboard for tracking team engagement dynamics in a project.


Data Visualization Charts for Interactive Report Creation in Excel.
Dashboard Templates