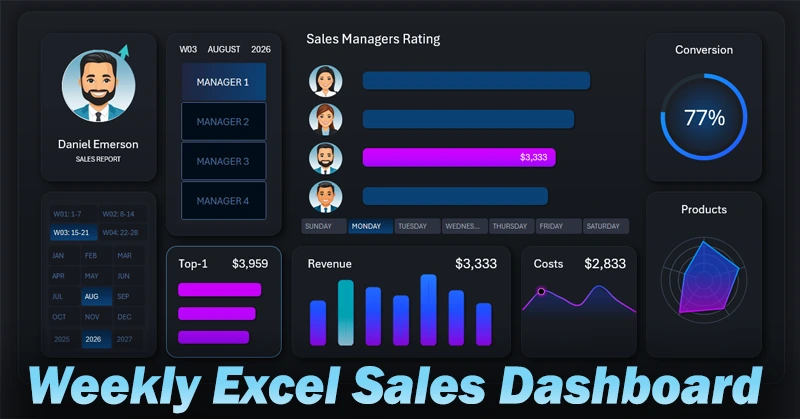
Excel Dashboard Report for Weekly Sales Team Meetings
Weekly sales team meetings are a key tool for managing your sales force. To make these meetings productive, it's important to quickly see who is performing well. It's just as important to highlight where there are deviations from sales targets.
Excel Dashboard for Weekly Sales Performance Meetings
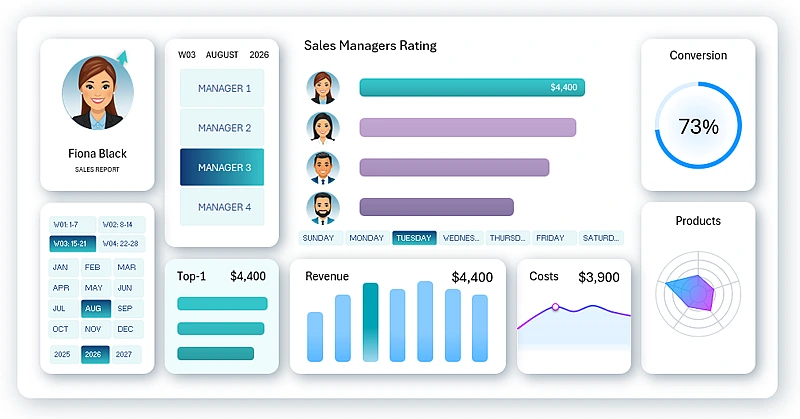
This template provides an example of how to effectively present weekly results using an Excel dashboard and simplify meeting preparation. What metrics should be included in a dashboard for weekly sales analysis? That’s a great question — and the answer is in the video, which covers:
- Dashboard grid layout template for positioning visualization blocks.
- Source data structure for the weekly sales dashboard.
- Creating pivot tables by salesperson.
- Connecting pivot table slices to filter and segment salespeople.
- Filling the ranking table with dynamic GETPIVOTDATA formulas.
- Using array formulas with CTRL+SHIFT+Enter to sort the sales rankings.
- Interactive dynamic chart design showing sales volume rankings in descending order.
- Sorting salesperson photos by condition using charts and Excel formulas.
- How to create a photo slider for salesperson cards in Excel with dynamic labels.
- Sleek dashboard logo design.
- Designing a pivot table slicer to use as a dashboard menu.
- Creating an interactive and functional design for KPI cards on the dashboard.
- Setting up data for a bar chart of sales revenue.
- Source data table for a weekly expense line chart.
- Source data for a radar chart displaying weekly sales activity across product categories.
- Dashboard screen for detailed analysis of sales target performance by revenue.
- How to create a custom toggle button design in Excel.
- Dashboard screen for detailed analysis of limited expenses by day of the week.
- Screen showing the distribution of weekly sales activity across basic product categories.
- Screen for analyzing lead-to-sale conversion rates.
- KPI card links for switching between dashboard screens.
- Presentation of the weekly sales dashboard with salesperson filtering.
If you’re looking for usage instructions and a breakdown of the purpose for each visualization block on this dashboard, we recommend reviewing the following resource:
Dashboard for Weekly Planning in Excel
The Excel dashboard makes meetings more structured and focused. The manager gets an objective weekly overview, and salespeople receive clear feedback. Use this approach to improve team performance and reduce reporting preparation time.


Data Visualization Charts for Interactive Report Creation in Excel.
Dashboard Templates