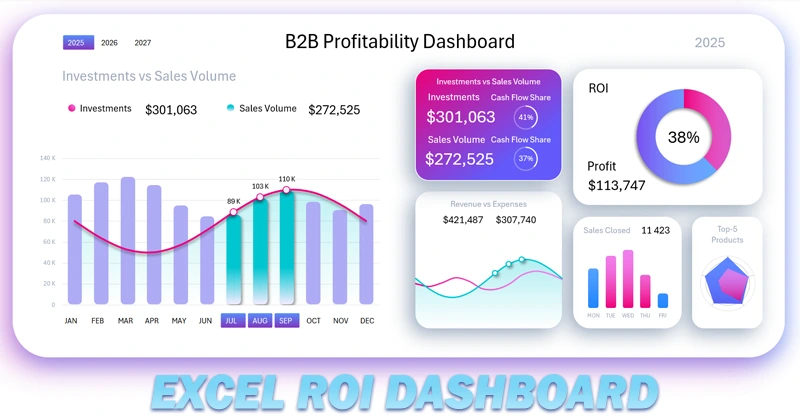
Excel ROI dashboard for product purchase profitability
Product investment ROI analysis is a key element of financial control for B2B distributors. Proper profitability assessment helps allocate the purchasing budget for maximum return and minimal risk. This Excel dashboard example brings together all the necessary metrics for simultaneous monitoring of revenue, sales, purchases, and payback, which is especially important for asynchronous business cycles.
Example of a dashboard for monitoring business reinvestment profitability
This dashboard template is multifunctional and has a multi-screen format. It is ideal for business models where goods are sold to retail companies with deferred payment. To learn how to create a dashboard for analyzing B2B business profitability, use the video tutorial. There you will see:
- How to create a beautiful complex gradient for the background in Excel.
- Dashboard grid design in a portable tablet style.
- Processing source data and building pivot tables for the dashboard.
- Source table for building an interactive combined bar chart.
- Adding and connecting button blocks for the bar chart and dashboard.
- How to create a beautiful bar chart for planning small business investments.
- How to create an attractive line chart for comparing income and expenses in Excel.
- Example of building a chart to present positive and negative ROI values.
- Block for monitoring the use of investment capital relative to sales.
- Formulas for dynamic labels on the dashboard.
- Bar chart showing the number of closed deals by day of the week.
- How to create a radar chart with a circular grid in Excel.
- Process of creating a screen for detailed comparative income and expense analysis.
- Creating a dashboard screen for analyzing the number of closed deals by day of the week.
- Creating a screen for analyzing revenue and sales distribution by product category on a radar chart.
- Screen for analyzing monthly ROI change dynamics throughout the year.
- How to create an interactive menu in Excel to switch between sheets without macros.
- Presentation of the dashboard for analyzing small business product investments.
The second video shows part two. There you will see the process of developing the light version of the design:
- Dashboard grid with colored shadow settings.
- Combined bar chart with an interactive data selection function.
- KPI card design.
- Income and expense line chart with a cursor.
- Bar chart with rounded column corners in Excel.
- Radar chart for analyzing revenue and sales distribution by product category.
- How to create a circular grid for a radar chart in Excel.
- Donut chart showing investment ROI.
- Screen for analyzing the ratio of revenue to expenses.
- Screen showing the number of closed deals by day of the week.
- Screen for revenue and sales volume distribution by product category.
- Screen for analyzing monthly ROI change dynamics.
- How to switch between dashboard screens in Excel.
- Presentation of dashboard capabilities for analyzing B2B product reinvestments.
Description of the purpose of each dashboard screen for business reinvestment analysis:
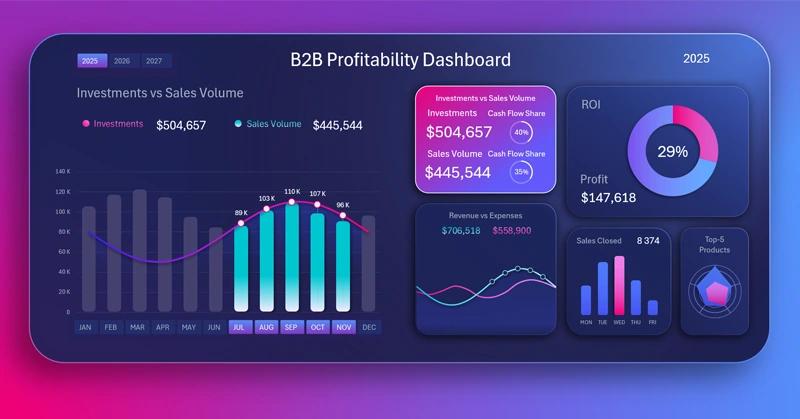
Excel dashboard helps control the profitability of product purchases
Using the investment ROI analysis dashboard in Excel, distributors gain a clear picture of purchasing and sales efficiency. This tool allows for faster response to changes in profitability, improved planning, and sustained business growth.
Download Excel ROI dashboard for product purchase profitability

Data Visualization Charts for Interactive Report Creation in Excel.
Dashboard Templates