Excel Sales Performance Report Template for Salespeople
Keeping track of salesperson performance is the key to increasing sales. But plain tables don’t give the full picture. Here you’ll find a ready-to-use dashboard template created in Excel.
Sales Report by Salesperson in Excel Dashboard Format
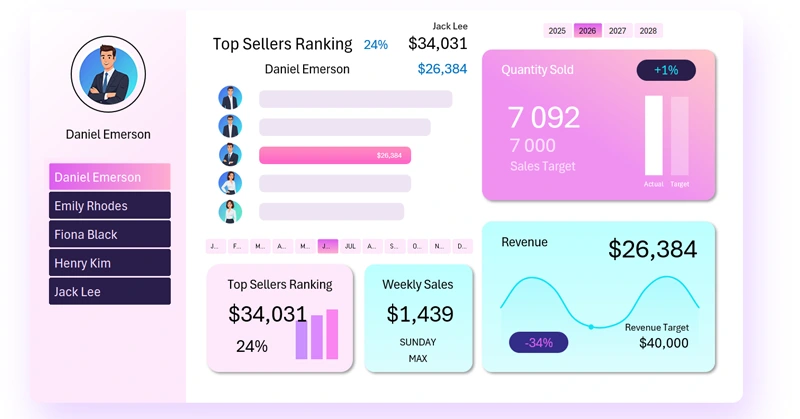
This interactive sales report template helps quickly evaluate each employee’s performance, compare results across time periods, and make informed management decisions. What metrics should you include in a salesperson performance dashboard? Instead of answering, we recommend watching the video tutorial on how to build this kind of template in Excel, which shows:
- Building a dashboard grid for visualization blocks.
- Preparing source data to create pivot tables.
- Interactive dashboard menu as a filter by salesperson.
- Top sales ranking for comparative analysis.
- Weekly sales bar chart.
- Monthly revenue and target sales indicator.
- Sales volume analysis by month.
- Dashboard presentation for salespeople in Excel.
The second part of the video tutorial covers how to:
- Create a light-themed dashboard grid with pink and purple accents.
- Design a simple yet stylish logo in Excel.
- Process source data using Excel pivot tables.
- Create a menu with a slider using pivot table slicers.
- Build a ranking chart for salespeople sorted in descending order using the SORT function.
- Sort images in Excel.
- Add buttons to switch between years and months on the dashboard.
- Create a screen to analyze revenue trends by weekdays.
- Build a local standalone control element for interactive bar chart weekday selection.
- Design a screen for analyzing monthly revenue by salesperson.
- Build an informative interactive chart to track yearly revenue target performance by salesperson.
- Create a screen to analyze product sales volume by each salesperson and the team overall.
- Set up interactive sheet switching in Excel.
- Present the dashboard for salespeople in Excel.
A detailed guide on how to practically use the interactive report is available here:

The Main Benefits of an Excel Dashboard for Salesperson Analysis
A well-designed Excel dashboard turns messy data into a clear picture. It helps not only identify weak points but also strengthen your team’s advantages. Use the ready-made structure and adapt it to your goals — this will make your sales management more transparent and effective.
Download the Sales Performance Report Template for Salespeople in Excel 

Data Visualization Charts for Interactive Report Creation in Excel.
Dashboard Templates