DOWNLOAD Excel Chart for SKU and Product Availability
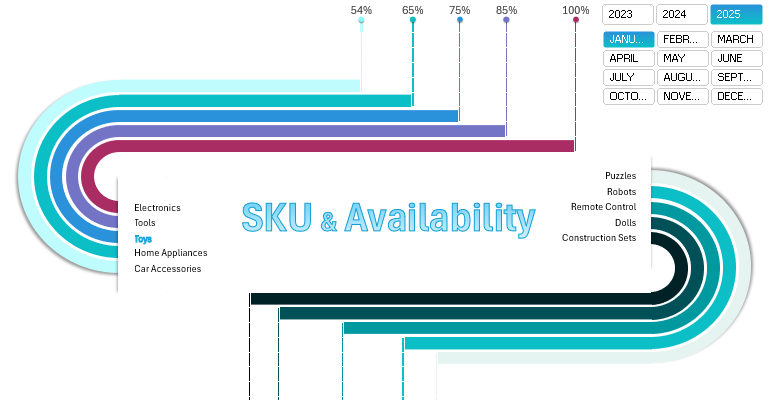
Learn how to create mini dashboards in Excel with a step-by-step video tutorial on building data visualizations as a combination of shapes and charts. The video shows the entire process of creating a small dashboard in Excel step by step. At the end of the article, download a ready-made report presentation template for analyzing the efficiency of product positions and product availability in Excel format.
Quick Monitoring of SKU and Availability Dynamics

SKU (Stock Keeping Unit) – A unique code for identifying a product in the assortment.
Availability – The number of available products out of the total offered.
The SKU and Availability metrics are used across all types of businesses. They are most commonly applied in the following industries:
- Retail trade.
- Logistics and supply chain management.
- E-commerce.
- Manufacturing.
Both metrics are used in practice in absolute and percentage terms. This dashboard presents SKU and Availability exclusively in percentages.
In the video lesson, you will learn:
- Creating a formula table for building a complex chart structure.
- How to create a dynamic chart template for infographics.
- Designing a complex chart using a group of vector shapes.
- Processing raw data through Excel tables and pivot tables.
- Formulas for selecting and sorting incoming data.
- Adding dashboard controls using slicers.
- How to quickly create dynamic charts using a ready-made Excel template.
- How to create custom data controls on the dashboard.
- How to quickly create interactive dashboards using a ready-made Excel template.
- Testing the functionality of the interactive presentation for the SKU and Product Availability report.
If you want to learn more about SKU and Availability metrics, how the mini-dashboard works, and where it is applied, we recommend exploring this information:

How to Create a Mini Dashboard for SKU and Product Availability in Excel
In the next video lessons, we will cover more complex dashboards, but for small businesses.
Download SKU and Product Availability Chart Template in Excel 
