How to Make SKU and Availability Mini Dashboard in Excel
Here’s another mini-dashboard for our collection. This time, we’ll present a report on essential business metrics: SKU and Availability. Since sales exist in every business, this type of report can be beneficial in any industry.
How to Use a Mini-Dashboard for SKU and Availability Analysis in Excel
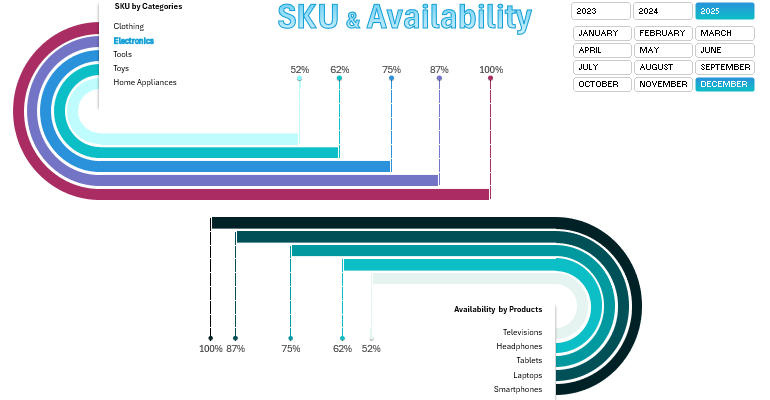
The mini-dashboard efficiently visualizes report data for SKU and Availability metrics over a specified period:
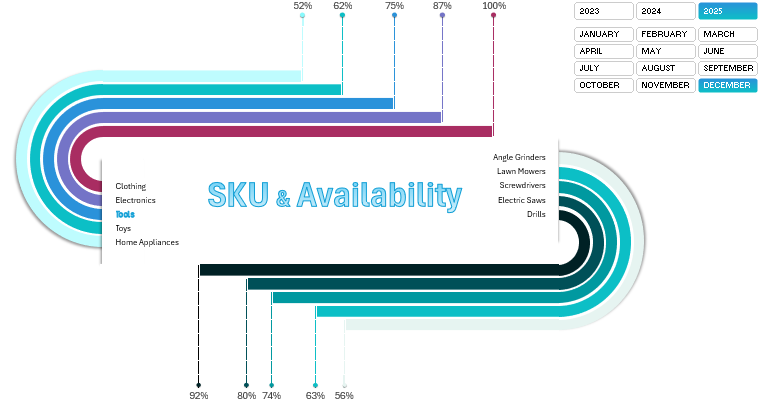
The dashboard template has a two-level control structure:
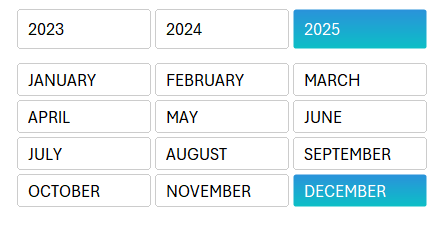
- Top Level. A slicer block for "Year and Month" – used to select the reporting period for data visualization. It manages the entire integrated mini-dashboard.
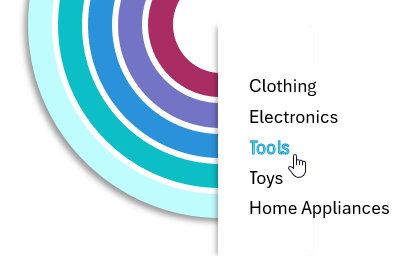
- Nested Level. A custom menu made of Option Button controls from the “Developer” tab. It manages one dynamic chart for the Availability metric.
At the center of the dashboard, there are two related visualization blocks:
- Top-5 SKU Categories.
- Top-5 Availability values within each category.
First, select the reporting period by setting slicer parameters for pivot tables by year and month. You can make multi-selections (e.g., multiple years or months) by holding the CTRL key while clicking. This is useful for summarizing data for a quarter, half-year, or other specific periods relevant to your business.
As a result, the horizontal bar charts update along with the data labels. For the first chart (SKU categories), the data labels also act as a selection menu for the second chart, which displays the Top-5 products in terms of Availability within the selected category.
Let’s take a closer look at each chart.
What is an SKU (Stock Keeping Unit)?
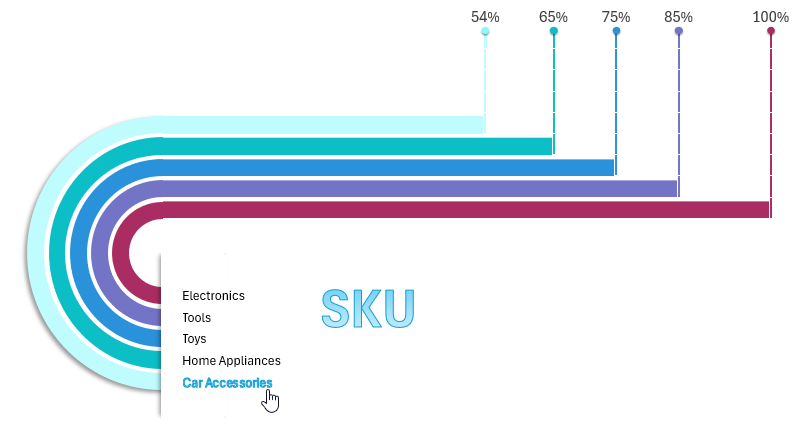
SKU (Stock Keeping Unit) is a unique identification code used for managing an inventory. SKUs differentiate products in warehouses, stores, or ERP systems.
What Does an SKU Code Look Like?
Example of an SKU for a medium-sized black T-shirt from brand X: X-TS-M-BLK.
Algorithm for Generating an SKU Code
An SKU is usually a combination of letters and numbers describing a product’s key characteristics, such as:
- Product Type: T-shirt.
- Size: S, M, L, XL.
- Color: black, white, blue.
- Manufacturer or Brand: e.g., X.
In inventory reports, SKU is often presented as a percentage, even though it's a unique identifier. For example, our dashboard template uses SKU in the context of inventory management, where percentages evaluate sales performance by category. It depends on whether SKUs are treated as product codes or performance metrics.
Examples of SKU Usage
- Inventory Management. SKU availability formula:
- Sales Analysis. Formula for SKU’s sales share:
- Return Rates by SKU.
- SKU Depletion Rate.
- Profit Margin by SKU.
SKU codes are widely used in inventory audits, logistics, and order optimization. They also measure product assortment breadth. For example, Walmart’s inventory has over 10 million SKUs, whereas Cisco’s catalog includes about 1,000 SKUs.
What Is Product Availability and How Is It Used?
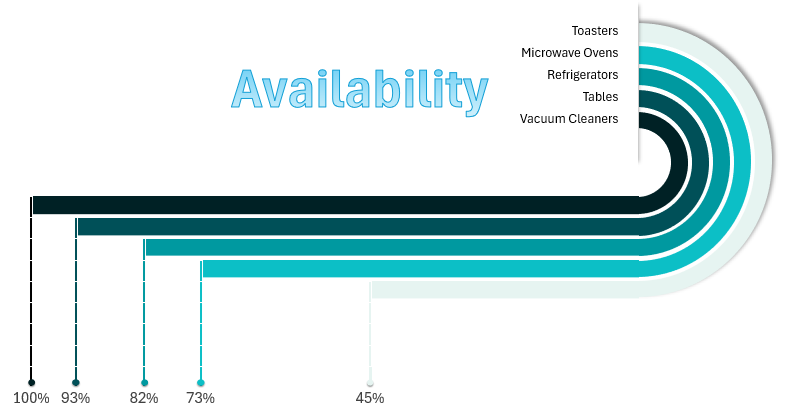
Availability is a metric showing whether a product, service, or resource is accessible for purchase, use, or consumption at a given time. In retail and logistics, Availability plays a crucial role in managing inventory, planning demand, and ensuring customer satisfaction.
How to use the Availability metric:
- Inventory and logistics management.
- Demand forecasting and planning.
- Data analysis and reporting.
- Monitoring customer satisfaction.
- Pricing and marketing strategies.
Availability is often expressed as a percentage. Formula:
To get an absolute count of available products on shelves or in storage, the value is provided as a numeric quantity.
Presenting SKU and Availability Metrics in Excel
To showcase how to create data-rich visual reports in Excel, we designed an additional dashboard screen with mirrored layout, giving the dashboard a new look:
Download Mini-Dashboard for SKU and Availability Analysis in Excel 
As demonstrated, Excel lets you build interactive and visually appealing mini-dashboards quickly, even from templates. With creative design approaches, the possibilities are endless. Stay tuned for more.
