Dynamic Charts for a CRM Dashboard in Excel Template
Learn how to develop dynamic charts for an Excel CRM dashboard using standard tools. This guide covers methods for real-time data visualization using pivot tables, slicers, and formulas—no macros required!
Masterclass on Data Visualization for CRM Dashboards in Excel
Discover how to create dynamic charts for an Excel CRM dashboard using built-in tools like pivot tables, slicers, and structured tables.
Step-by-Step Video Lesson Outline:
- Foundation for building data visualizations from CRM systems.
- Preparing source data for pivot table creation.
- Using GETPIVOTDATA formulas to extract values from pivot tables.
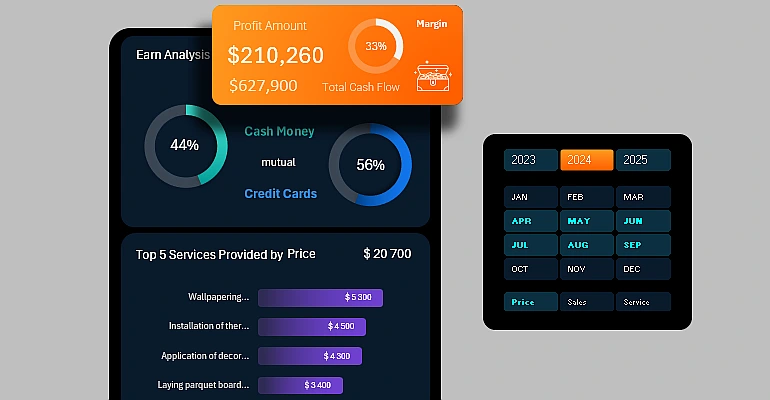
- Charts for comparing cash and non-cash payments.
- Formulas to calculate profit margin for chart creation.
- Filling the pivot table area with profitability data.
- Formula tables for sorting the top 5 ratings across three key metrics.
- How to create an interactive rating chart with toggles for different metrics.
- Building a sorted chart in descending order to present the full rating view.
- Creating a dynamic income and expense chart with the ability to select specific periods for display.
- Reviewing the visualization block for the CRM dashboard.
This example is a standalone section of a comprehensive multi-screen dashboard with CRM system functionalities.
Use these templates as tools to create simple, accessible, yet effective CRMs in Microsoft Excel.

Excel Dashboard Templates for Business

Data Visualization Charts for Interactive Report Creation in Excel.
Dashboard Templates