DOWNLOAD Investment Portfolio Tracking Excel Dashboard
Excel is a powerful tool for creating dashboards that offers numerous possibilities for data visualization and analysis. These features may not be obvious at first glance, but we will dive deeper into Excel’s visualization capabilities to unlock its full potential for developing interactive dashboards.
Video Tutorial: Developing an Investment Portfolio Tracking Dashboard in Excel

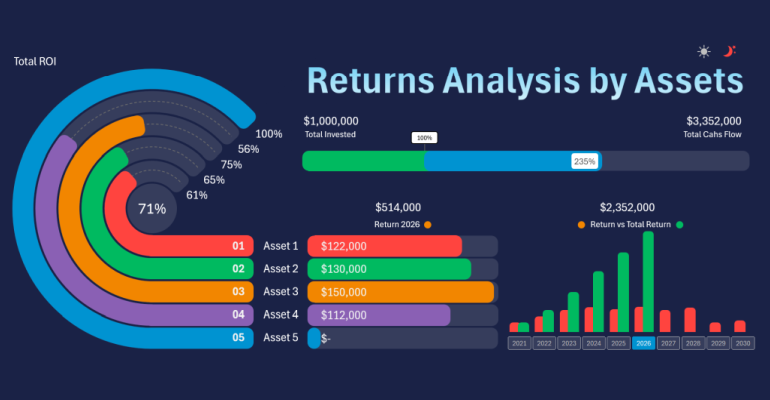
In this video tutorial, you will learn how to create a dashboard for analyzing an investment portfolio. The interactive Excel dashboard template will help investors track and compare the performance of their portfolio assets. It also enables quick calculations of asset profitability potential and optimization of investment strategies.
In this video tutorial, you will learn how to:
- Create smart and pivot tables based on raw data.
- Connect formulas to pivot tables.
- Develop formulas for a complex doughnut chart template.
- Customize a dynamic design for a doughnut chart in Excel.
- Link a pivot table slicer and use it as a dashboard control element.
- Create a bar chart and integrate it with the doughnut chart’s design composition.
- Build formulas for a column chart to compare capital inflow and accumulation from assets.
- Visualize the cumulative return on investment progress with a bar chart in Excel.
- Design a progress bar with functional styling and dynamic moving labels in Excel.
- Label all data visualization blocks on the dashboard.
- Design a light theme for the dashboard to analyze asset profitability using the template.
- Test the functionality of the interactive dashboard for presenting an investment portfolio in Excel.
The structure and steps for creating an investment portfolio tracking dashboard in Excel are outlined here:

Excel Dashboard for Investment Portfolio and Asset Management
This dashboard will help you make informed investment decisions and improve portfolio management efficiency. Create an effective dashboard for analyzing and monitoring your investment portfolio in Excel with us. Learn how to visualize asset profitability data using simple tools. Explore ways to compare various investment strategies and manage risks in upcoming lessons.

