Investment Tracker Dashboard for Portfolio Manage in Excel
We present to you a positive and simple, yet interesting and useful dashboard for tracking and managing the assets of an investment portfolio in Excel. The main focus of the data visualization is the return on investment speed. After all, for an investor, preserving capital is much more important than just making money.
Asset Tracking Dashboard for Investment Portfolio in Excel
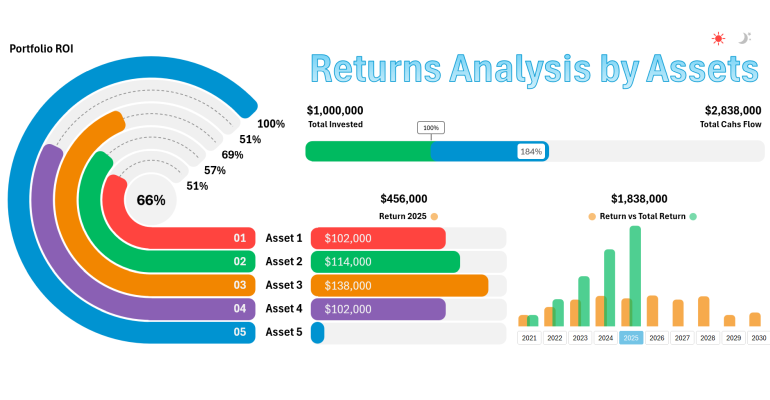
The structure of the dashboard is minimalist. Therefore, the design composition of the template consists of just four visualization blocks. Let’s take a closer look at each of them.
Portfolio ROI
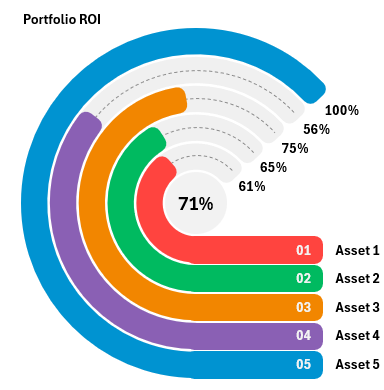
The first block allows you to monitor the return on investment for the asset portfolio in percentage terms.

Five investment assets are shown, and their comparison to achieve full payback – 100%. The progress bars on the circular chart for asset payback compete against each other, much like horses in a race at a racetrack. The investor, as the user of the dashboard, can monitor which asset, or “horse”, reaches the goal first after refreshing the data.
The assets of the investment portfolio can be various investment objects that take up to 10 years to pay back. For example:
- Branded wine or cognac.
- A piece of agricultural land.
- Commercial real estate.
- Commercial transport for freight or delivery.
- Special equipment for construction or agriculture.
- Production equipment.
- Farms for breeding agricultural animals.
- Patents or copyrights on inventions.
- Rare collectible coins, items, vintage cars, and vintage furniture.
- Elite tree variety orchards.
For example, gold is not on this list as investments in gold will not provide a 100% return in 10 years. Meanwhile, aged cognac typically doubles its value every 6 years.
Select 5 types of assets to track the efficiency of your investment portfolio in Excel on the "Processing" and "Data" sheets by replacing Asset 1–5 with the names of each asset. Then press the CTRL+ALT+F5 hotkey combination to update the data in all pivot tables and formulas.
Return on Investment by Portfolio Assets

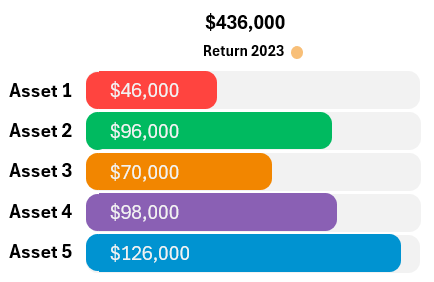
The second block analyzes the absolute values of the amounts returned by investment assets. These two blocks complement each other conceptually and share a common data label scale.
Comparative Analysis of ROI and Capital Growth

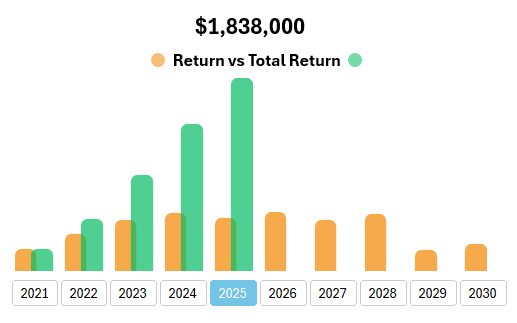
The third block allows us to monitor and compare the dynamics of capital growth with the annual ROI level of the investment portfolio. For example, we may no longer be concerned by the low ROI of the portfolio in 2029 because by then the portfolio has already paid itself off three times. This means the investor’s strategy was quite justified.
This section also features a set of buttons to control the dashboard. When selecting a year, all data on the charts update accordingly.
Portfolio Payback Progress Bar

The fourth block is the visualization of the final values of the dashboard. This block shows the current ROI level of the portfolio during the present accounting period. It also illustrates the breakeven point (100%) on the timeline of the average payback of all assets in the portfolio.
Template Dashboard for Portfolio Asset Analysis and Management
In general, the entire dashboard design looks positive, both in the light and dark version of the interface skin. Some design elements have practical functionality while retaining their aesthetic appearance.

Download Investment Portfolio Tracking Dashboard in Excel 
If you take a broader look at the standard features that Excel offers and study them a little, you can discover new talents in data visualization and dashboard development. Note, all features are implemented without the use of macros. Only standard tools: formulas, pivot tables, slicers, and of course, chart templates.
