How to use CONCATENATE function for Excel dashboard charts
An example of creating simple formulas for searching, segmenting, filtering, and extracting values from source data without using pivot tables. This allows new data to be automatically updated across all charts on the Excel dashboard, even in streaming mode.
INDEX and MATCH Formula with Multiple Criteria in Excel
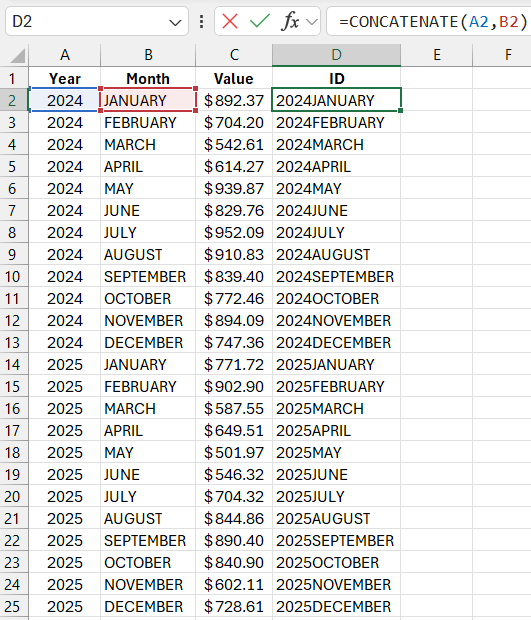
The CONCATENATE function allows you to combine values from different cells into a single text string. You simply need to reference the cells with the values you want to concatenate in the function’s arguments.

Where and how to use the CONCATENATE function? For example, in INDEX and MATCH formulas to find a value in a table based on multiple criteria.
For the source table, use the CONCATENATE function to generate a unique ID for each row based on the table's source data. The ID consists of two parts: the Year and the Month.
Define two criteria for searching and extracting values from the source table. Use the INDEX function for extracting values based on these criteria. In the first argument of the INDEX function, reference the range of values, which is the last column in the source table from which we will extract values. For the second argument, we need to specify the row number, but first, it must be found.
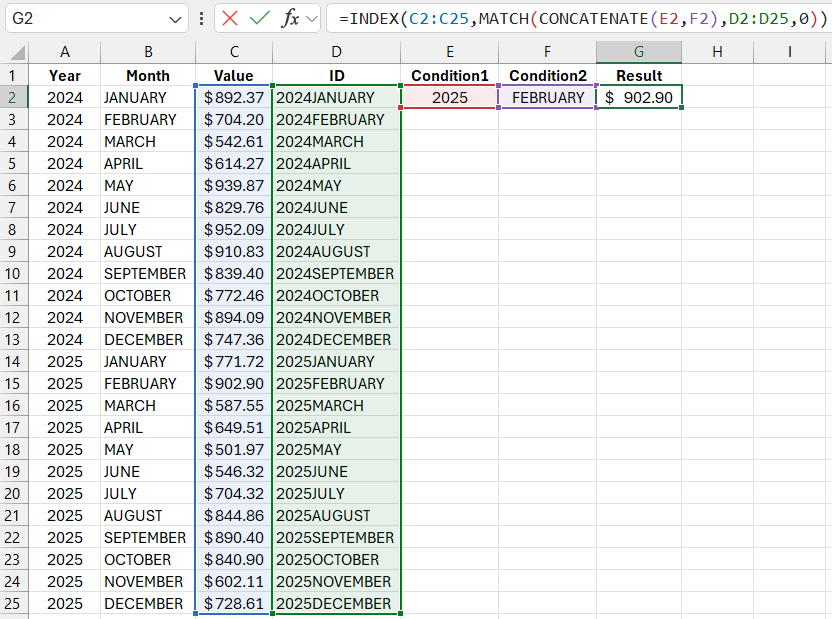
Now, to find a value based on two criteria, we need to use the CONCATENATE function in the first argument of the MATCH function, which will combine both criteria into one ID code for the rows in the source table. As a result, the MATCH function will find the correct row number based on the ID code and pass it to the INDEX function, which will return the value corresponding to the two criteria.
To avoid generating a column with ID codes for the table rows every time, you can use the CONCATENATE function in the second argument of the MATCH function as well. In this case, reference the entire ranges of cells containing the years and months.
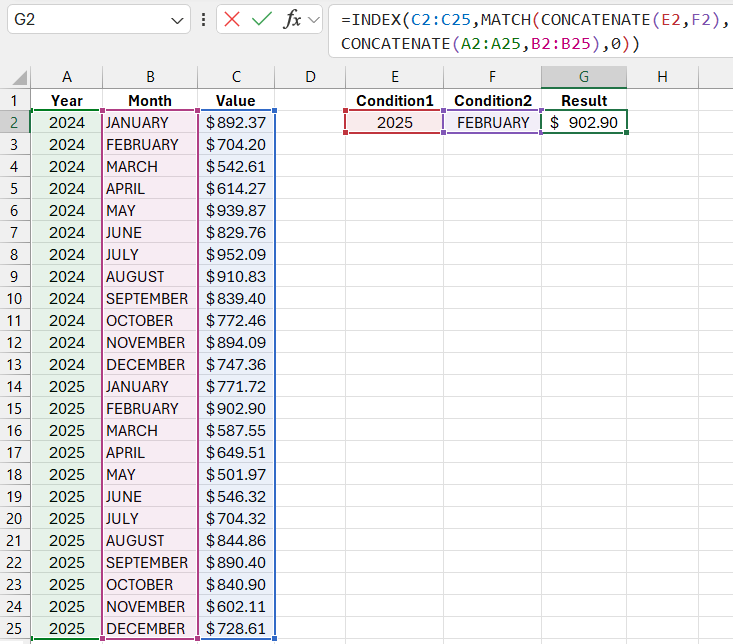
For convenience, add two drop-down lists for the two criteria and apply conditional formatting.
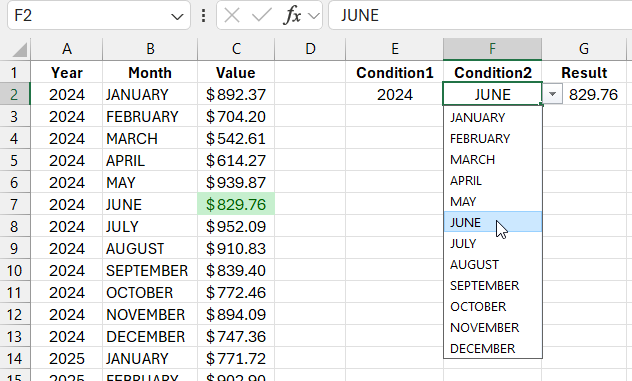
The principles outlined here will be used in formula algorithms to prepare data for visualization.
Template of Data Processing Formulas for Dashboard Charts
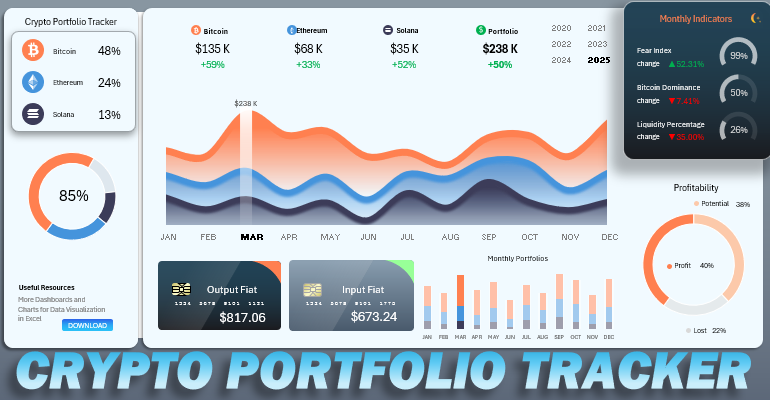
The CONCATENATE function is often used when visualizing data, especially when creating interactive dashboards. These frequently require searching and extracting data from tables based on multiple criteria. Pay attention to the dashboard template formulas for extracting source data from the "Data" sheet based on conditions defined on the "Processing" sheet. The CONCATENATE function is used there.
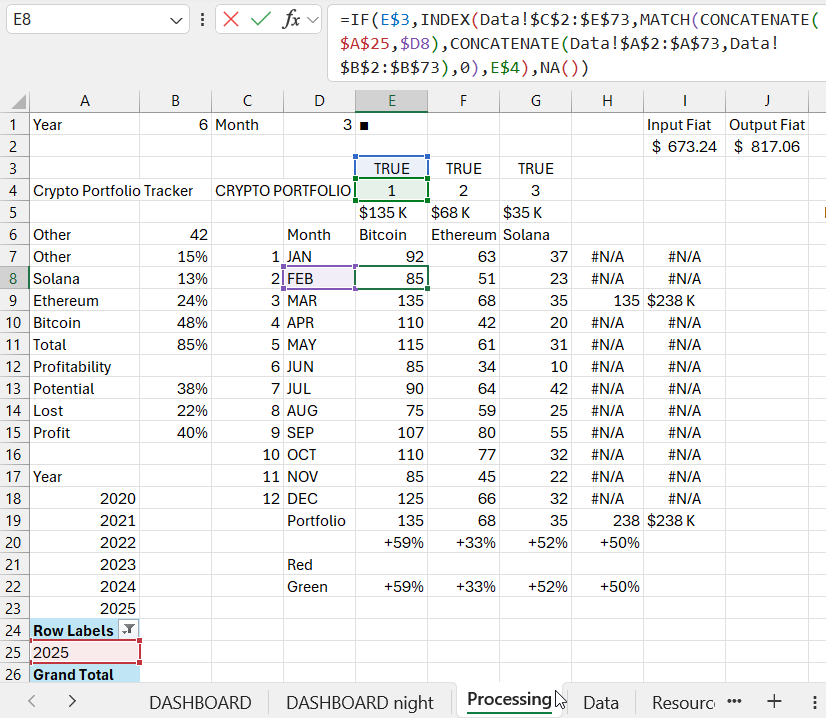
The dashboard itself is quite presentable and has two design modes:
- Dark mode for night use.
- Light mode for daytime work.
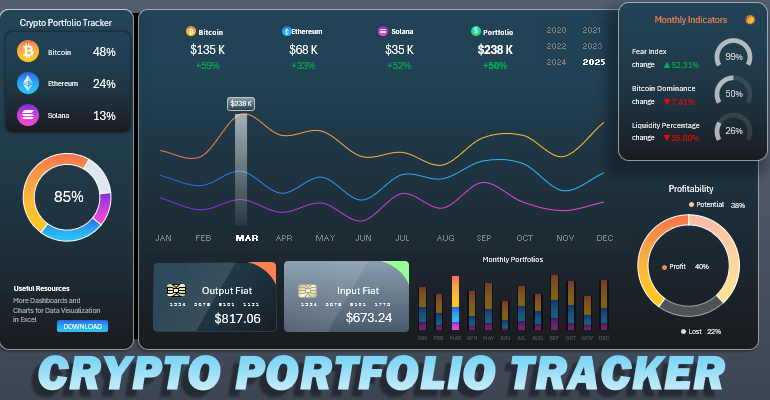
All formulas are simplified and located on the "Processing" sheet. Fill in the table with source values on the "Data" sheet. The dashboard is very simple, with charts that have no complex features. The template can be freely used and expanded to suit your needs.

