Medical dashboard in Excel for patient history analysis
Working with a patient’s medical history requires accuracy and a structured approach. Excel data visualization capabilities make it possible to build an interactive dashboard for comprehensive clinical review. The infographic updates automatically based on all collected daily statistical health indicators throughout the entire course of the illness. This approach is both convenient and effective. It enhances attention to detail and supports intuitive, timely decision-making.
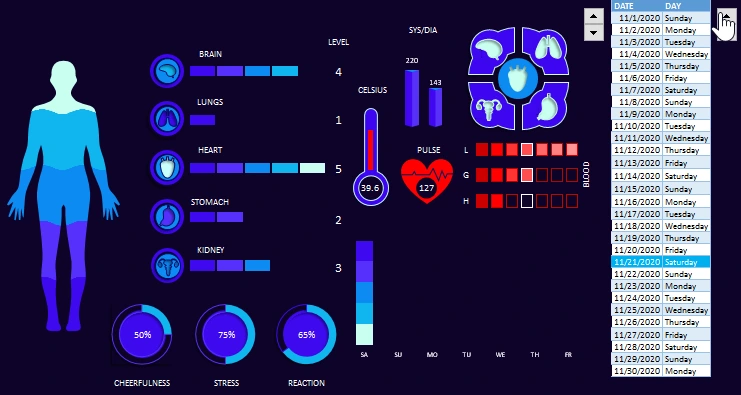
Example of a dashboard for comprehensive medical assessment

An Excel dashboard allows you to consolidate:
- Clinical indicators.
- Examination results.
- Patient condition dynamics.
All of this is presented on a unified analytical panel for fast, evidence-based, and well-balanced decision-making. This template can also be used to analyze medical checkups performed across different time periods:
- Ultrasound (US);
- MRI;
- ECG;
- Laboratory tests (blood, urine).
Enter the collected data on the “Data” worksheet and make sure to specify the date in the first cell of each row in the source data table.
Benefits of visualizing medical history in Excel
The dashboard tracks key patient indicators:
- Trends in test result changes.
- Treatment stages and their impact on the patient’s condition.
- Diagnostic status of vital organs:
- heart;
- brain;
- lungs;
- stomach;
- kidneys.
During analysis, the dashboard’s interactive features allow you to temporarily exclude diagnostic data for specific vital organs to reduce informational noise and focus on the most critical problem areas.
You can also assess the overall health condition by temporarily excluding problematic zones from the analysis.
This is an important function, as medical diagnostic and treatment strategies are often based on the principle of exclusion.
Detailed instructions for using the template are described here:
Dashboard for patient medical history analysis in Excel
This medical Excel dashboard provides:
- A holistic overview of the patient’s condition.
- Continuous monitoring of indicator changes.
- Improved transparency of clinical analysis.
The interactive data structure simplifies working with medical history and supports informed professional decision-making.


Data Visualization Charts for Interactive Report Creation in Excel.
Dashboard Templates