Progress chart for personal financial goals in Excel
Keeping personal financial goals under control helps you understand how close you are to achieving your plans. A progress chart in Excel clearly shows the path of achievement, simplifies analysis, and encourages regular budgeting and resource planning.
Useful progress chart for personal finance tracking in Excel
Keeping personal finances and treating hard earned money carefully is very important. But that alone is not enough for motivation. First you need to answer the most important question in life — WHY?
The personal finance goal planning section is often underestimated by users of finance tracking apps. That is a big mistake. This section is responsible for the main motivator to keep disciplined records. Visualization of progress toward goals is very important for this section.
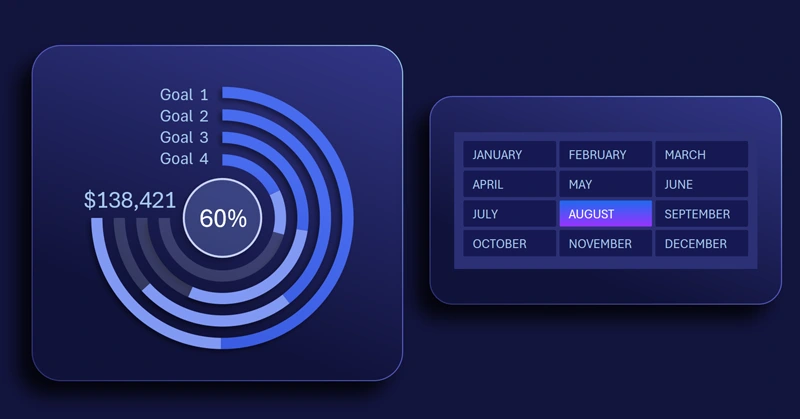
This chart is a clear example of how you can build your own chart in Excel to track progress for multiple goals at once, goals that may compete for your attention and effort.
The chart design is modeled after running tracks at a stadium. Each bar line fills as it moves toward the finish. This compact design uses dashboard space efficiently and is also suitable for mobile app versions.
The finish value shows the current results in absolute terms. The center displays the average relative percentage of overall progress across all goals. At the start are the current values for each goal (shown in absolute and/or percentage terms).
You will find the ready template at the link at the end of the article. But it is better to learn how to build these important interactive charts in Excel yourself. Use the tutorial video below to learn how to:
- Create a doughnut chart based on the second formula table.
- Set parameters and colors for all chart rings.
- Add a shape for the visualization background design.
- Add a shape for the foreground design.
- Add dynamic labels linking to cells with formulas.
- Add pivot table slicers to create control buttons.
- Test the chart for tracking goal progress.
This chart template is showcased effectively on the final screen of a large dashboard:
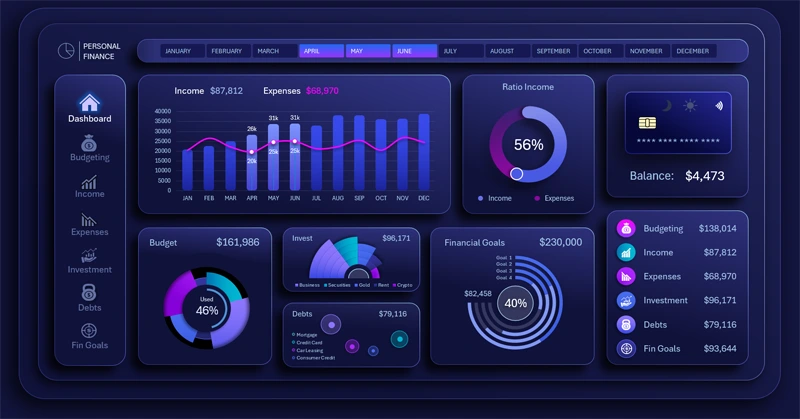
Multifunctional dashboard for managing personal finances in Excel
Using a progress chart in Excel makes personal finance management transparent and effective. It helps track goals, motivates budget discipline, and simplifies cash flow analysis. Start using this tool to reach your financial goals faster and with more enjoyment.
Download the progress chart for personal financial goals in Excel 

Data Visualization Charts for Interactive Report Creation in Excel.
Dashboard Templates