Project Development Management Task Manager in Excel
An effective dashboard in Excel provides a clear way to track key project stages, analyze progress, and make informed decisions. Monitoring project progress is the key to its successful completion. Data visualization on an Excel dashboard helps quickly assess the current state of project development. This tool allows you to identify problem areas and adjust the action plan accordingly. Let’s explore which report elements will help you better analyze project data!
Presenting Project Development Dynamics with an Excel Dashboard
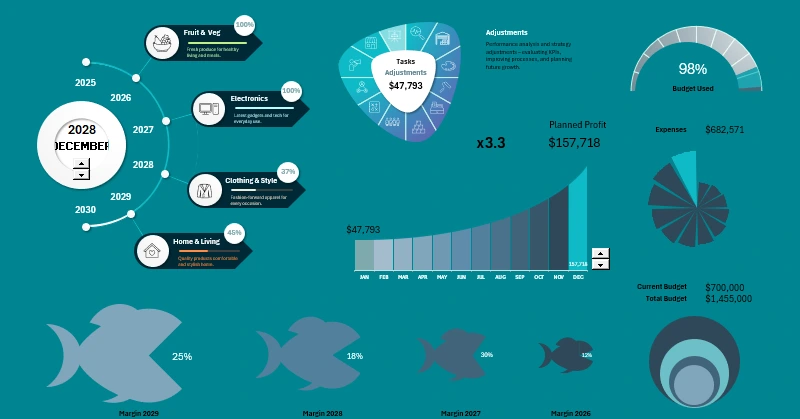
In this video, we will explore how to present data on task completion, timelines, and resources using Excel’s visual tools. We will cover the principles of developing the following data visualization elements:
- Progress scale on a timeline for an Excel dashboard.
- Project task manager in Excel for the dashboard menu.
- Exponential growth curve on a bar chart and using an Excel formula.
- Progress indicator in the form of a speedometer in Excel.
- Polar chart in Excel.
- Engaging infographics for an interactive Excel dashboard.
For a more detailed explanation of the practical use of this dashboard template and a breakdown of each visualization block, check it out here:
Excel Project Management Dashboard with Infographics
The Excel dashboard is a powerful tool for presenting and analyzing project progress data. Clear visualization of deadlines, resources, and key metrics helps make informed decisions and ensure timely task completion. Use intuitive charts and graphs to control every stage of your project!


Data Visualization Charts for Interactive Report Creation in Excel.
Dashboard Templates