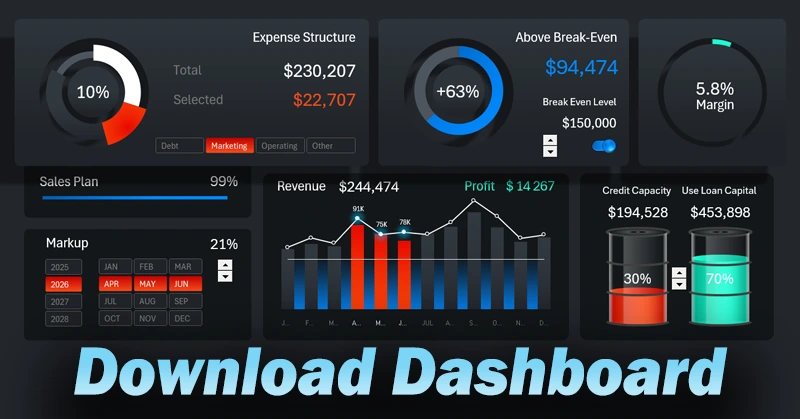
Quick credit usage analysis for small business in Excel
In small business, it's important to quickly understand how borrowed funds affect financial performance. A complex report isn’t always necessary – sometimes a compact tool for quick assessment is enough.
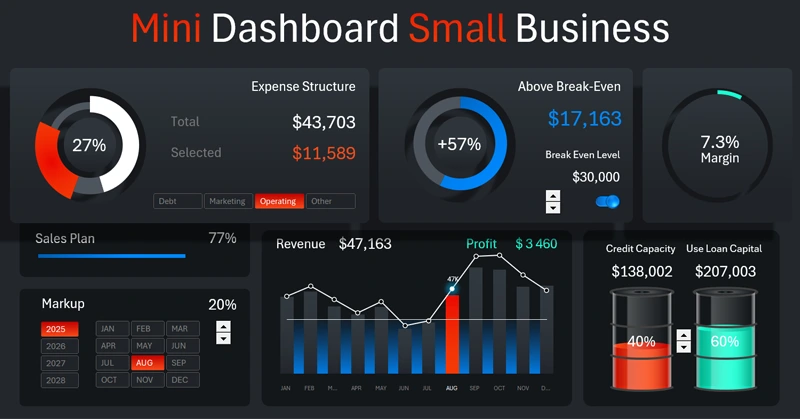
Debt Load Control Using Key Indicators
This Excel dashboard is designed for a quick check on how effectively borrowed capital is used and what the current debt load is. You can create this kind of dashboard yourself by following a single video tutorial. You'll learn how to:
- Start developing a mini-dashboard template using a grid layout.
- Prepare source data and the first table for the first visualization block.
- Create the first dynamic PivotTable based on the source data.
- Create animated infographics on credit usage in Excel.
- Create a second static PivotTable for the central combined bar chart.
- Add the first control elements to the dashboard.
- Use formulas to extract data from PivotTables based on conditions for dynamic charts.
- Create a combined, interactive bar chart with beautiful, dynamic, and functional design in Excel.
- Make an animated progress bar scale to analyze sales performance in Excel.
- Use PowerPoint to create complex presentation shapes.
- Create an interactive pie chart with a cursor and buttons to filter data by condition.
- PowerPoint has a better shape editor than Excel – use it to build new visualization blocks.
- Create a chart to analyze the level above the break-even point of a business project.
- Use a margin formula to present both positive and negative values in the data visualization.
- Group all blocks to add shadows for a dynamic dashboard design.
- Create a custom-designed button for a beautiful Excel dashboard interface.
- Present the mini-dashboard’s capabilities for analyzing small business financial indicators in Excel.
Detailed instructions on practical use and implementation of the mini-dashboard:
How to quickly analyze credit usage for small business in Excel
Speed and simplicity of analysis are especially important for small business. This Excel dashboard helps you understand the impact of loans without unnecessary data and respond to changes quickly. Fast decisions are a competitive advantage.


Data Visualization Charts for Interactive Report Creation in Excel.
Dashboard Templates