Sales Funnel Chart in Excel for CR progress analysis
A sales funnel shows how effectively potential customers move from first contact to purchase. A chart in Excel helps visualize conversion progress at each stage of the sales funnel. This makes it easier to identify weak points and improve performance control processes for each responsible team across all levels of customer interaction.
Template for Functional Sales Funnel Design in Excel
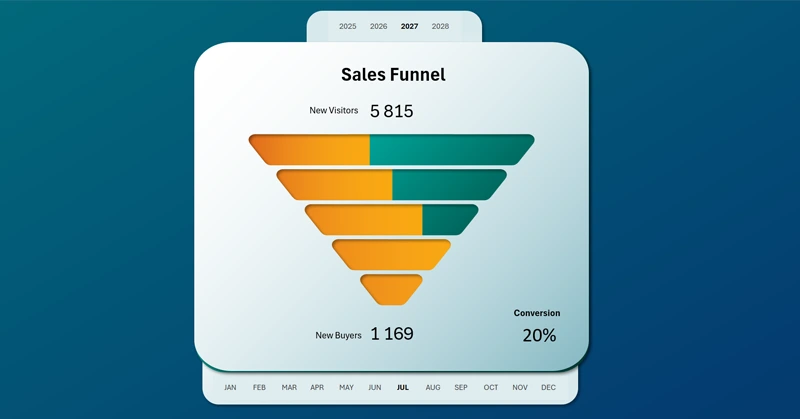
This version of the Excel sales funnel visualization uses a group of progress bars. Each sales stage has its own horizontal progress bar to display its CR (Conversion Rate). Naturally, each stage has its own CR benchmark. The higher the stage, the lower its conversion rate.
To create this stylish chart design in Excel, additional shape-editing tools in PowerPoint were required. There, a mask shape was created to overlay the horizontal bar chart in Excel. The training video clearly demonstrates how this was implemented:
- Build a pivot table based on the source data.
- Extract data from the pivot table for the chart.
- Create a horizontal bar chart template.
- Add pivot table slicer buttons for control.
- Create a chart mask shape in PowerPoint.
- Add shapes for the visualization background design.
- Create gradient fills and shadows for the mask shape.
- Customize the design of the horizontal bar chart.
- Assemble all objects into a sales funnel like a constructor.
- Adjust the visual style of the pivot table slicer buttons.
This type of data visualization is especially effective when used as part of a full dashboard together with other charts.
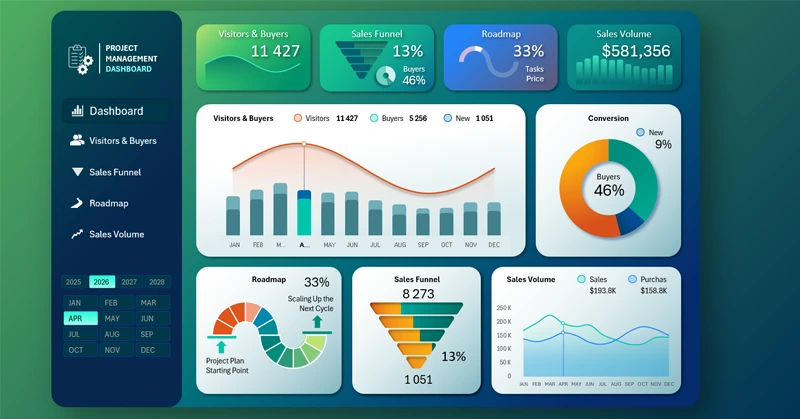
Dashboard with beautiful charts for sales management in Excel
The sales funnel chart in Excel makes analysis clear and transparent. It helps identify bottlenecks, optimize conversion, and improve business efficiency. Use this tool to refine your strategy and track key metrics. It supports fast, data-driven decisions for increasing revenue.


Data Visualization Charts for Interactive Report Creation in Excel.
Dashboard Templates