Sales Point Management Dashboard in Excel for POS Systems
A POS Dashboard, even when created in Excel, provides a structured and visually clear way to analyze sales data without the need for complex or expensive software. With customizable reports, interactive charts, and automated calculations, companies can easily track top-selling products and POS locations. Whether for small retail stores or large enterprises, an Excel-based dashboard enhances sales reporting in a single, accessible format.
How a Sales Point Monitoring System Benefits Businesses
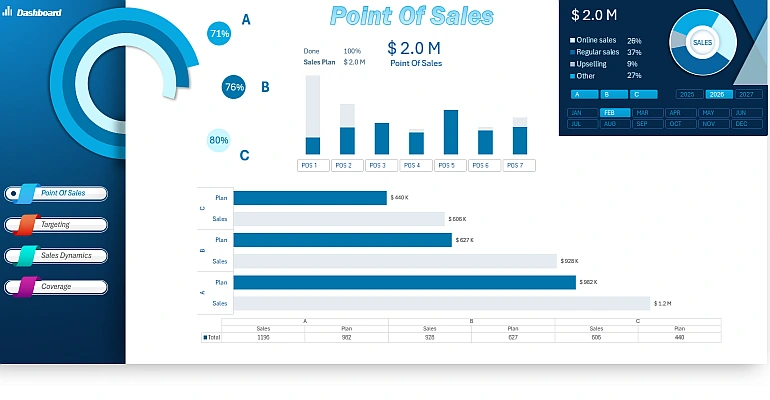
A sales point monitoring system (POS - Point of Sales) is a powerful tool for tracking sales, analyzing performance, and efficiently managing business operations. By integrating key sales data into an interactive dashboard, companies can monitor transactions, inventory, and customer trends in real time. This makes it an essential resource for retailers, restaurants, and service providers looking to optimize decision-making and increase profitability.
Data visualization significantly improves reporting quality based on data retrieved from the POS system. To see this in action, you can use the POS system dashboard template built in Excel.
Learn how to create such visual reports in Excel by watching the video, which covers the following aspects:
- Organizing source data and pivot tables.
- Adding control buttons for the sales point dashboard.
- Populating chart tables with formulas to extract data from pivot tables.
- Adding a separate panel for standalone bar chart control using a pivot table not linked to the source data.
- Formula table for a horizontal bar chart with combined value labels on the Y-axis.
- Design customization for a multi-layered bar chart template.
- Design customization for buttons and data slicer panel.
- Creating a horizontal bar chart with a data label table on the vertical Y-axis and a summary table.
- Testing the interactive capabilities of the sales point analysis dashboard.
This template is part of the full version of the ABC product analysis dashboard:
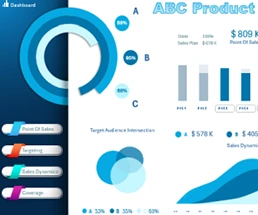
ABC Sales Analysis of Various Product Categories in Excel Dashboard
If you have any questions, feel free to ask them in the comments under the video:


Data Visualization Charts for Interactive Report Creation in Excel.
Dashboard Templates