Simple and beautiful Excel dashboard for data visualization
The Excel dashboard allows you to present and interactively visualize data in a single template. A simple and elegant design structure helps you quickly create an attractive report. If you urgently need to track key metrics, analyze trends, and make effective decisions without unnecessary complexity - use this template.
Beautiful Dashboard Template for Managing Metrics in Excel
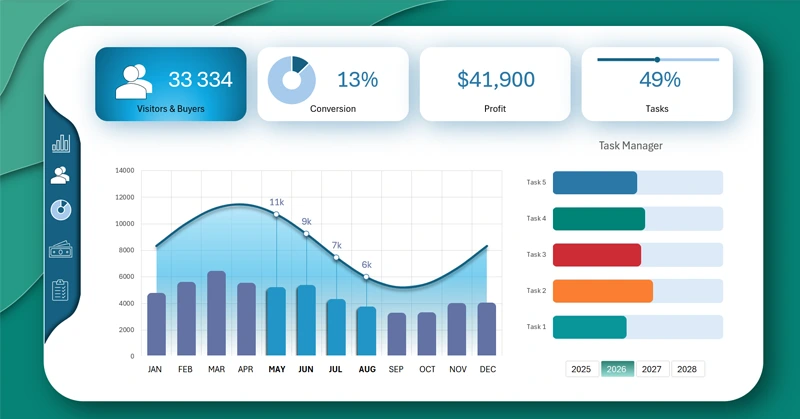
Using a simple and visually appealing dashboard in Excel makes working with data convenient and clear. A ready-to-use template file is provided at the end of this article. But if you want to learn how to quickly create your own efficient dashboard with a beautiful design, use the video tutorial that shows:
- Design modeling of the dashboard background using Excel shapes.
- Creating a tablet-style dashboard design.
- Reinforcing the material through repetition.
- How to create a functional bar chart design with a cursor.
- How to make a combined bar chart with rounded columns.
- Adding interactive elements for dashboard control.
- How to create a horizontal bar chart with rounded columns.
- Creating an interactive icon for menu buttons using a chart.
- How to create an interactive progress bar in Excel.
- Creating dynamic data labels using formula references.
- Presentation of a simple yet beautiful Excel dashboard.
This template includes descriptions for all visualization blocks on each dashboard screen in a detailed usage guide:
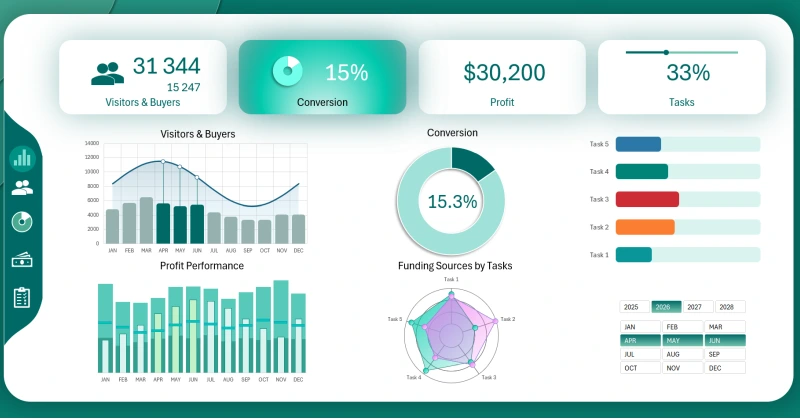
Example of a project management dashboard in Excel
Even minimal skills allow you to create informative reports that help quickly evaluate metrics and make decisions. Start building your own dashboard today to make data analysis easier and more effective.


Data Visualization Charts for Interactive Report Creation in Excel.
Dashboard Templates