Speedometer-Style Progress Bar as an Excel Dashboard Widget
The speedometer chart progress bar in Excel is a powerful tool for visually tracking project progress. This format allows for a quick assessment of task completion levels, comparison of actual versus planned metrics, and presentation of data in a clear and stylish manner.
Example of a Speedometer Chart Progress Bar in Excel
How can you effectively display current project progress? The speedometer chart in Excel helps instantly evaluate task completion rates and identify deviations from the plan. This indicator is particularly useful for presentations and reporting, allowing you to visualize key performance metrics. In this video tutorial, we will explore how to structure performance data using this visualization tool. Video highlights:
- Formulas for time tracking in months and years.
- Initial dashboard template design setup.
- Adding and configuring control element buttons.
- Formulas for calculating the progress bar chart.
- Creating a speedometer-style progress bar chart in Excel.
- Design customization for the multi-layered chart across all data series.
- Adding shapes to construct a modern visualization design.
- Enhancing the visualization with dynamic data labels.
- Testing the functionality of the speedometer-style progress bar with dynamic design.
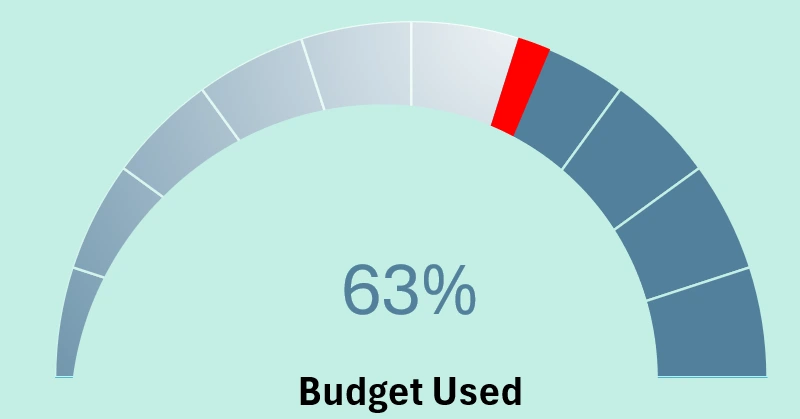
This template can be used to visualize annual budget expenditure tracking, as demonstrated in the following example:
Excel Project Management Dashboard with Infographics
The speedometer chart in Excel is a powerful tool for visual progress analysis. It allows for a quick assessment of task completion status, identification of delays, and presentation of results in an easy-to-understand format. Use this visualization method in Excel to improve project progress monitoring and create more engaging reports!


Data Visualization Charts for Interactive Report Creation in Excel.
Dashboard Templates