Sprint Cycle Chart in Excel for Scrum and Agile teams
The sprint cycle chart in Excel allows you to visually track task completion within Agile and Scrum frameworks. It helps the team manage sprints, monitor progress, adjust plans, and improve project transparency.
Step-by-step guide to creating a sprint cycle chart in Excel
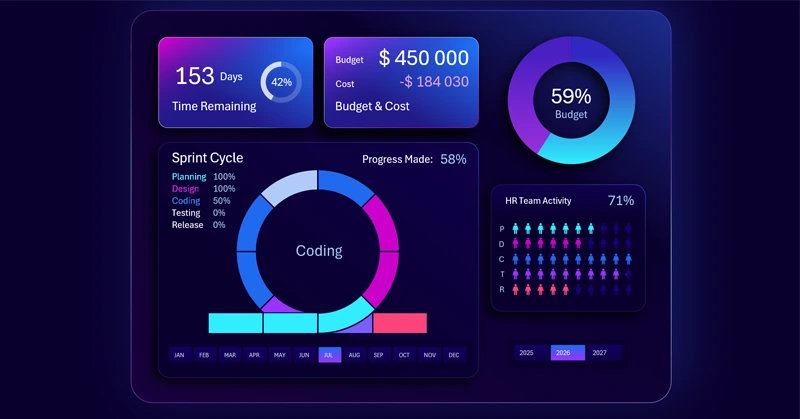
The task cycle chart in Excel shows the progress of each sprint process circle. It helps the team plan work and quickly identify schedule deviations.
You can quickly learn how to create such interactive infographic templates by watching the tutorial video at the end of the article. There you will learn:
- Dashboard base design for a mini dashboard in Excel.
- KPI cards in a glass neon style.
- 3D block design for data visualization and dashboard grid layout.
- Processing and configuring source data using Excel pivot tables.
- Formula tables for dynamic charts.
- Using pivot table slicers to control the Excel dashboard.
- Interactive budget spending progress chart.
- Stylish button design for Excel mini dashboard control.
- Formulas for building an interactive Agile sprint chart.
- How to create a sprint chart for Agile project management in Excel.
- Dynamic sprint circle task labels with progress indicators.
- Chart for analyzing Human Resource management within sprint teams.
- How to use PowerPoint to create interactive infographics in Excel.
- Dynamic data labels with formulas for KPI cards.
- Presentation of sprint chart usage in Excel.
Use this technique for creating interactive charts in thematic Excel dashboards:

Agile project management for Excel dashboard developers
Creating a sprint cycle chart in Excel improves project management, helps track progress, and enables timely decision-making. This visual tool makes teamwork more organized and efficient.


Data Visualization Charts for Interactive Report Creation in Excel.
Dashboard Templates