Task Manager Menu in Excel for Project Progress Analysis
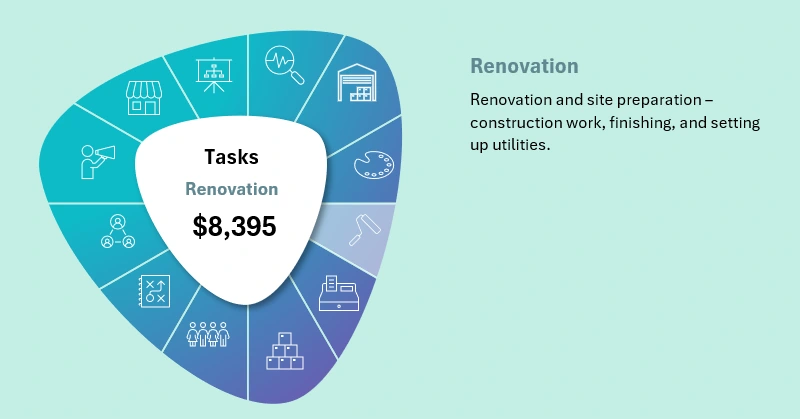
The task manager menu in Excel helps structure project progress data, track task statuses, and quickly access up-to-date information. How can you keep task execution under control? The task manager menu in Excel visually represents work statuses, deadlines, and responsible parties. This format is useful for internal analysis as well as presentations to clients or teams. Download the data visualization template block to make task monitoring as efficient as possible!
Example of an Interactive Task Menu for an Excel Dashboard
How can you analyze task execution in a project using an Excel dashboard? In this video, we will explore how to use a dashboard to analyze work progress, identify problem areas, and effectively present project status. Video tutorial content:
- Setting up formulas for processing source data and tables for a pie chart.
- Creating a control panel.
- Adding a visualization control element.
- Constructing an interactive data visualization block using shapes and charts.
- Creating a pie chart to animate the task manager menu.
- How to create complex-shaped figures in Excel for a creative dashboard design.
- Designing the task menu with built-in Excel icons.
- Adding dynamic informative data labels.
- Presenting the interactive task manager for the dashboard.
How to integrate the task manager menu so that it seamlessly fits into a dashboard composition with charts can be seen in this example:
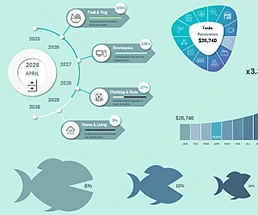
Excel Project Management Dashboard with Infographics
The task manager menu in Excel is a convenient tool for structured project progress analysis and presentation. Dynamic data updates and interactive charts help quickly identify problem areas and monitor completed work. Download the visualization template to efficiently manage project tasks!
Download the Task Manager Menu Template for an Excel Dashboard 

Data Visualization Charts for Interactive Report Creation in Excel.
Dashboard Templates