Task progression Funnel in Excel for backlog
An interactive task flow funnel is a visual model of a streaming workflow from the initial idea to the completed outcome. It structures the backlog by priorities, reflects task processing stages, and enables control over flow stability within a project management system.
Structure of backlog funnel stages across task progression levels
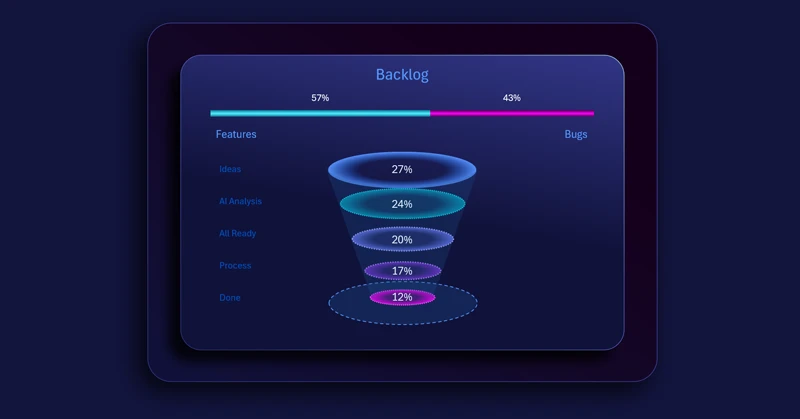
The backlog task funnel visualization block in Excel consists of two bar charts:
- The upper level displays a horizontal bar chart showing the ratio between opportunity growth and the impact of unforeseen errors.
- Below are sequential task progression levels from idea to implementation.
At the top of the block, a horizontal bar chart reflects the relationship between the project opportunity growth coefficient and the loss coefficient caused by errors or unexpected events. This indicator sets the overall context of system stability.
Below it is a customized clustered bar chart designed as a dynamic funnel with interactive capabilities.
The task funnel demonstrates how a task transforms through consecutive stages:
- Idea
- Prioritization
- Analysis and decomposition
- Planning
- Development
- Testing
- Implementation
Each level functions as both a filter and a selection mechanism. If overload or failure occurs at any stage, subsequent levels automatically lose stability — the flow slows down, stops, or becomes distorted.
Interactive funnel as an indicator of bottlenecks and process stability
The Excel visualization serves as a structural control tool, helping teams focus on the real state of the task flow.
It allows you to:
- identify task accumulation at a specific stage;
- detect delays or priority imbalances;
- evaluate process throughput;
- respond promptly to systemic disruptions.
This model is widely used in Agile, Scrum, and Kanban approaches, where flow continuity and status transparency are critical success factors.
Note: Learn how to effectively use a backlog task funnel within an interactive Excel dashboard:
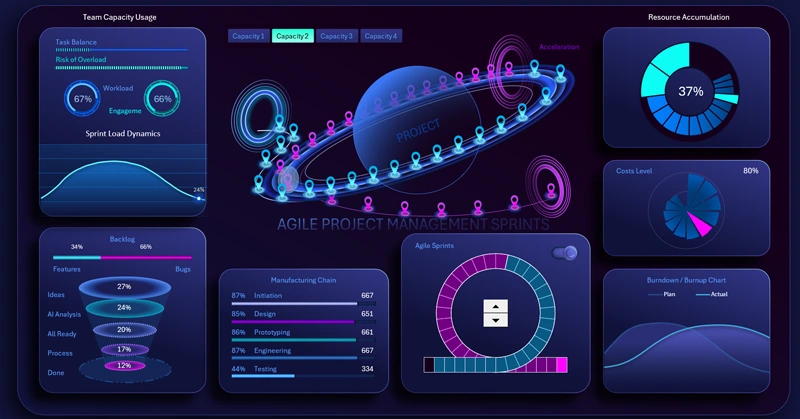
Creative dashboard for Agile-based project management
An interactive backlog task funnel built in Excel is not just a chart, but a structural lifecycle model of work execution. It combines the strategic layer (opportunity growth and risk factors) with operational task flow control. As a result, project managers gain a holistic view of project health, while teams receive a clear framework for maintaining a stable and manageable execution flow.
 Download the interactive backlog task funnel in Excel
Data Visualization Charts for Interactive Report Creation in Excel.
Dashboard Templates