How to make Transformation Table in Excel Example Download
The transformation table in Excel significantly saves time and effort in preparing IFRS reports. There are many advantages to this transformation method: accessibility for most users, arithmetic accuracy, clarity of adjustments, and the ability to conduct economic analysis based on IFRS results. The Excel model created not only serves as a report but also acts as a management tool.
Preparatory Stage
The task is to analyze specific differences between IFRS applicable to a particular sector and the accounting policy under GAAP. The company's activities should begin to be analyzed from the perspective of international standards.
At the initial stage, the accounting policy according to IFRS is updated, a list and rules for calculating main adjustments are formed, and a list of additional information required for IFRS purposes is compiled. Subsequently, this data is continually updated since legislative requirements are constantly evolving.
The next step involves mapping balances and turnovers formulated under the GAAP chart of accounts to the IFRS chart of accounts. When compiling the latter, it's essential to follow several recommendations:
- Each indicator is assigned a unique numerical code. A letter-number format of a specific pattern is possible. To minimize errors when summing up indicators in Excel, directories and drop-down lists with codes are used. You can also sum based on certain criteria using the SUMIFS and VLOOKUP functions.
- Automating form filling with Excel tools is feasible if each item contains a balance sheet line code and a notes table code (besides its own code).
- To avoid having to reconfigure Excel formulas when introducing new accounts or sections, it's advisable to leave blank lines in each section of each report and space for new sections.
- For data comparison and auditing, a history of changes is maintained, indicating the legislative act, responsible person, validity period, etc.
Subsequently, all the information required for filling the transformation model is gathered, significant operations are analyzed, and initial adjustments are made.
Creating a Transformation Table in Excel
Transformation is the mechanical translation of reporting formulated according to IFRS standards. Every organization uses transformation tables that suit them; there are no universal forms.
Let's consider an example of creating a small transformation table in Excel. The company's reporting includes:
- Balance Sheet.
- Profit and Loss.
- Cash Flow.
- Movement of Basic Financial Assets.
| BALANCES | 2015 |
| Fixed assets | 59800 |
| Long-term financial investments | 17000 |
| Reserves | 10000 |
| Unfinished production | - |
| Finished products | 2000 |
| Cash and cash equivalents | 4 |
| Accounts receivable | 3100 |
| BALANCE | 91904 |
| Authorized capital | 51500 |
| Retained earnings (uncovered loss) | 11504 |
| Profit Loss) | 4200 |
| long term duties | |
| Accounts payable | 24700 |
| BALANCE | 91904 |
| Profits and Losses | 2015 |
| Revenue | 45450 |
| Cost price | -40200 |
| Business expenses | |
| Administrative expenses | |
| Profit (loss) from sales | 5250 |
| Other income and expenses | |
| Current income tax | -1050 |
| Profit (loss) of the reporting year | 4200 |
| Cash flow statement | 2015 |
| Cash balance at the beginning of the year | 12 |
| Cash flow for current activities. Revenue | 45450 |
| Payment for goods, works, services | -17900 |
| Salary | -19800 |
| Calculation of taxes and fees | -1050 |
| Total for current activities | 7750 |
| Cash flow for investment activities. Sale of fixed assets, non-current assets | |
| Purchase of fixed assets, profitable investments in material assets, non-material assets. | -6100 |
| Loans provided to other companies | -510 |
| Total for investment activities | -6610 |
| Cash flow for financial activities | - |
| Credits and loans | - |
| Total for financial activities | - |
| Net increase (decrease) in monetary terms | 1140 |
| Cash balance at the end of the year | 1152 |

It's necessary to adjust the balance as of December 31, 2013. New data won't be included in the 2015 report. Adjusted values will affect the retained earnings of previous years.
We'll make some adjustments to the balance:
- Adjusting the authorized capital for inflation. In accounting, when reflecting the authorized capital, inflation isn't considered, while in IFRS, it is. Data on inflation from the year the authorized capital was contributed to the year of financial statement transformation should be taken. Find the inflation index for the period (product of all indices). Recalculate the authorized capital. Suppose the inflation index was 1.72. Then the inflated authorized capital will be 51500 * 1.72 = 88580. The adjustment amount is 88580 - 51500 = 37080. The authorized capital needs to be increased, and the retained earnings of previous years need to be decreased.
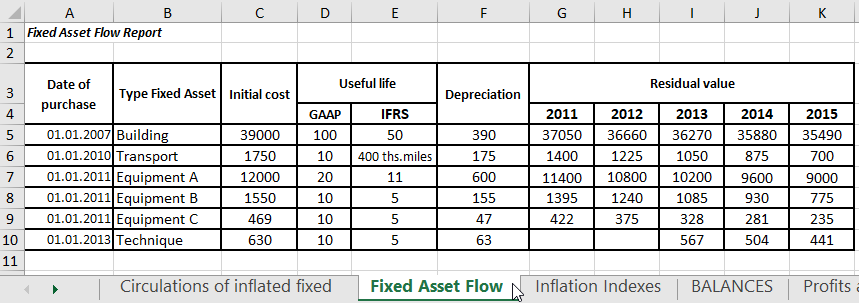
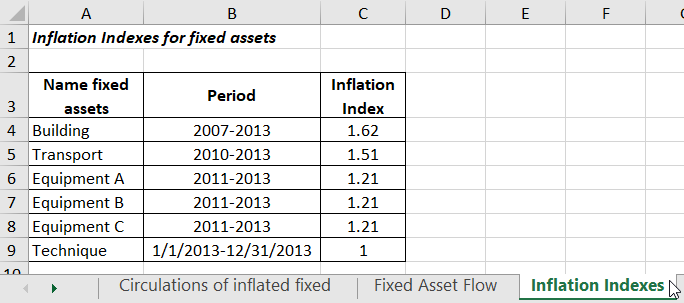
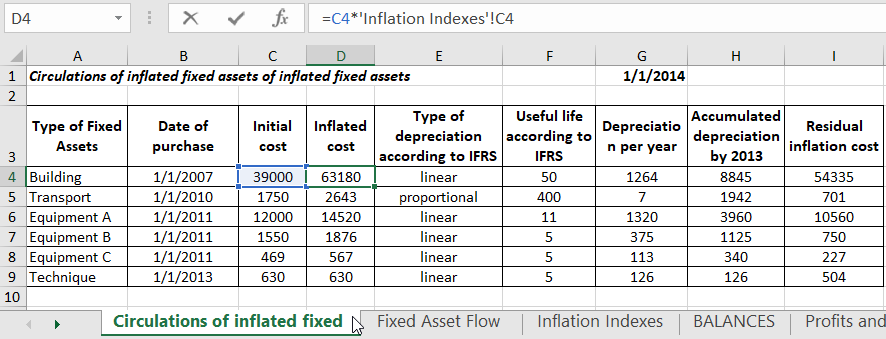
- To adjust the value of fixed assets, you need to inflate their initial cost and recalculate depreciation according to international standards. Prepare a working table with inflation indices for different periods (*).

* All figures are hypothetical. Provided solely for illustration of the transformation process.
We'll perform the necessary calculations in the working transformation table.

 Download Transformation Table in Excel with Example Filling
The "GAAP" and "IFRS" columns are filled using references to the corresponding values in the respective tables. The adjustment amounts represent the difference between the evaluation of fixed assets according to IFRS and GAAP.
The adjustments already made should be replicated in the general adjustment table. In the example, the value of fixed assets and the authorized capital have already been transformed. Let's transfer this data (debit - positive value, credit - negative value).
In the example, two balance sheet items were adjusted, resulting in two adjustments. The final transformation table will have many more items and adjustments.
When creating a budgeting model using the transformation table in Excel, it's essential to consider the already adjusted economic indicators (according to IFRS).
