Creative Dashboard Control in Excel for Sales Management
The word computer comes from the Latin word computatrum, which translates into as “calculator.” Excel is a universal calculation tool! This is why MS Excel is the most popular program on all personal computers in the world today. 97% of offices use Excel to process, analyze, and exchange data in spreadsheet format. Therefore, it is important to know the full range of capabilities this universal program offers. It can be used for complex mathematical calculations, document form creation, data visualization, and much more — including gamification elements. Below is a small example.
Gamification with Visualization in Business and Everyday Life in Excel
How do you make yourself work effectively? Most people think about this question every day! The answer is based on a formula by one philosopher. Everything we do brings us either meaning and/or pleasure. If we have to force ourselves to work or do anything at all, it means the harmony between these two criteria is broken.
Adding Data Visualization to Pivot Reports in Excel
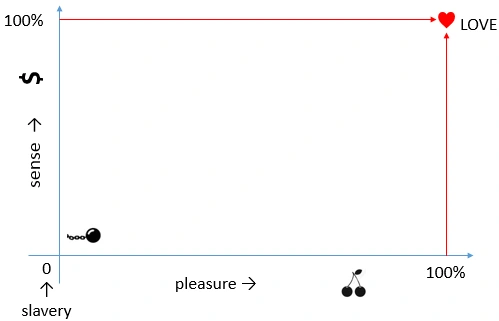
There are four scenarios:
- There is meaning, but no pleasure.
- There is pleasure, but no meaning.
- No pleasure and no meaning — this is slavery.
- There is pleasure and meaning — this is love for what you do!
Let’s create a simple visualization based on the data above. Thanks to data visualization, we can fully understand the overall situation, determine where we currently stand, and see the most rational solution. We also see the power of data visualization, which lies in a simple principle — making the right decisions quickly and effectively:
Data visualization significantly increased our understanding of the information above. By the way, in Greek mythology, a deity is defined as a being with higher awareness.
This is how data visualization works.
For the average office employee, the first scenario is usually the main cause of demotivation. Visualization helps increase the desire to act and love your work more. It transforms boring reports with numbers and formulas into interesting, beautiful charts and graphs that are pleasant to analyze and easy to understand with minimal effort.
Adding Gamification for Interaction with Report Data in Excel
Thanks to Excel’s broad capabilities, we can not only decorate boring data but also add gamification elements. The core principle of gamification is understanding and applying patterns. This principle connects gaming and real life — and this is extremely important for everyone! The more effective patterns you possess and the better you apply them (which is equally important), the more often you achieve life goals and win in games.
By adding beautiful visualizations and gamification elements to dull Excel reports, you significantly increase the enjoyment of the work process. Your mental energy grows, and your body produces hormones that give you energy and motivate you to act even more. As a result, you no longer have to force yourself to work — the work itself becomes an exciting game in which your reward is both salary and meaning.
This applies not only to employees but also to entrepreneurs. It does not matter whether you are a corporate or independent entrepreneur — the rules are the same for everyone. In fact, an entrepreneur should be “lazy” by nature, paradoxical as it may sound. The task of both corporate and private entrepreneurs is to find the best ideas and patterns to create satisfying income streams for core and non-core specialists. This is how economics works. It is no coincidence that in economics, enterprising individuals (3%–8% of the population) belong to the category of “economic goods” — entities that satisfy human needs. Exhausting work drains an entrepreneur and deprives them of creative power in the field of microeconomic business organization. Their mind must remain free and open, and visualization with gamification elements not only prevents burnout but also inspires new ideas for economic achievements for themselves and their team. This results in achieving more with less effort — that is mastery.
With the right reports, you will always have not only enough meaning to work, but also enough pleasure to motivate yourself and enjoy the process.
Dashboard with 3D Menu and Animation
To review an example of a dashboard with data visualization and a gamification element, let’s model a scenario. We have statistical information on sales for four product groups (Group A, B, C, and D) across five top managers of a company. All statistics are exported from the ERP system into an Excel file so that the indicators for each manager are placed on separate sheets (1-Manager to 5-Manager). The source data used for processing is highlighted in light blue:
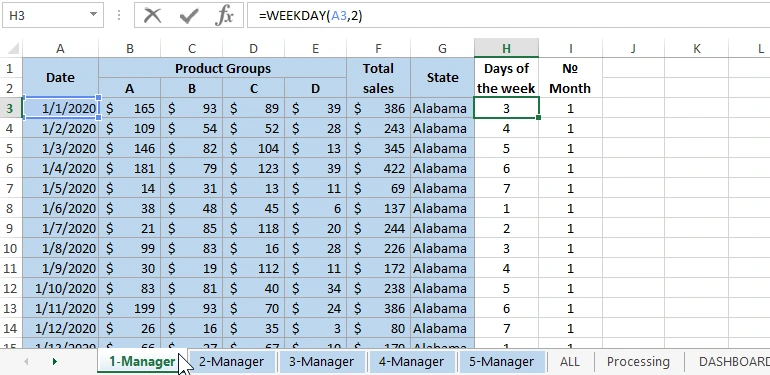
Cells and sheets without background color do not contain source data — only formulas.
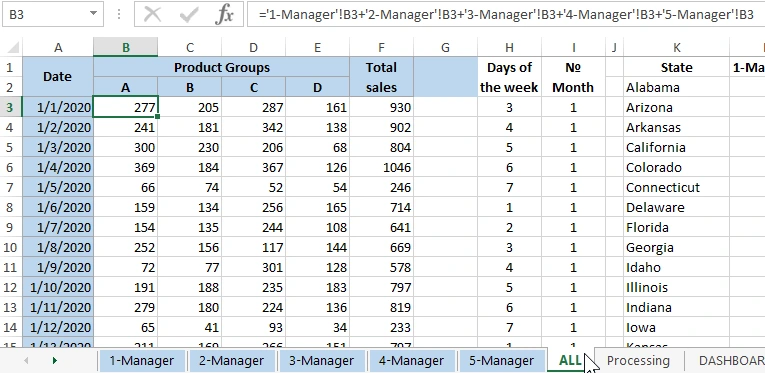
To obtain summary information for all top five managers, a separate sheet named “ALL” is created. It consolidates the data into overall indicators using formulas:
On the next sheet, “Processing,” the source data is prepared for output on the main “DASHBOARD” sheet in the form of data visualizations. This sheet also implements the interactive features of the 3D menu that allow users to control dashboard visualization:
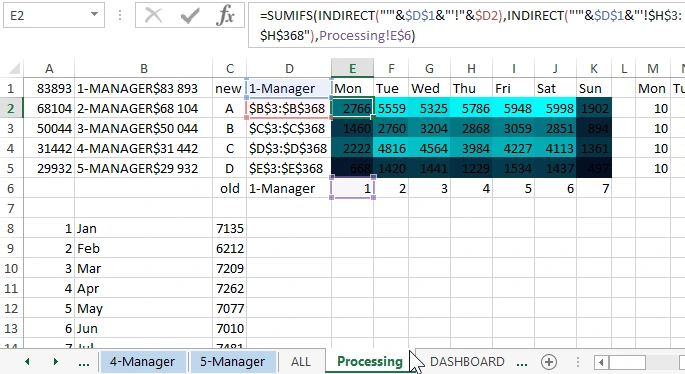
As shown in the image, the key switch that controls navigation between sheets through the 3D menu is the value in cell D1. The =INDIRECT() function processes the value of D1, converting it into addresses for external references in formulas that extract values from different sheets using the =SUMIFS() function.
The cell D1 is populated with sheet names using macros triggered by the 3D menu located in the center of the dashboard. Once D1 changes, the entire system works as a unified mechanism.
Next, let’s move on to the main sheet — DASHBOARD!
Structure of the Dashboard with Consolidated Sales Report from Multiple Excel Sheets
In this dashboard example, the central element is the 3D menu, which acts as a gamification feature:
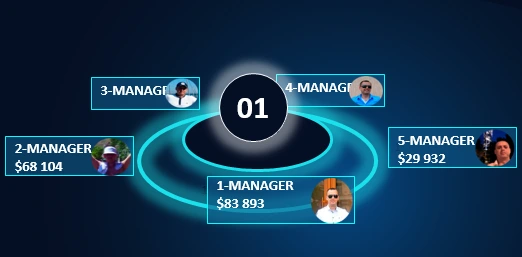
When clicking any menu item, an animation rotates the 3D menu wheel. After that, the dashboard data updates based on the selected manager. The indicators are filtered exclusively for the chosen manager.
If you click the center of the 3D menu on the dial, an animation transforms all menu items into a single large “ALL” button:

This resets all filters and updates the dashboard again to display overall performance metrics of the company.
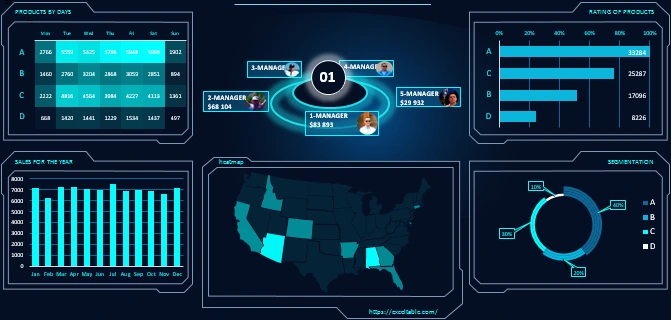
Due to the specific design of the dashboard’s chart and graph frames, it was difficult to label them clearly. Therefore, let’s briefly review all five blocks on the dashboard.
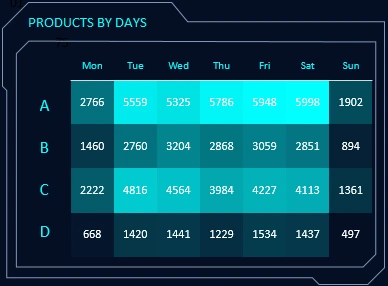
The first block, “PRODUCTS BY DAY,” is a heatmap showing sales activity for each product group on different days of the week across all managers:
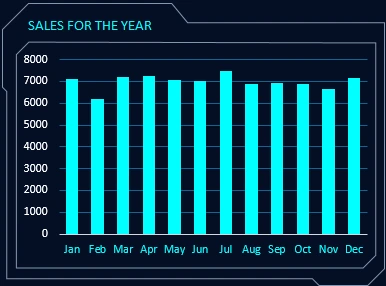
Below is the “SALES FOR THE YEAR” block. It is a standard bar chart showing monthly sales activity over the course of one year:
The central and largest block on the dashboard, “heatmap,” displays sales activity across U.S. states in the form of a heatmap:

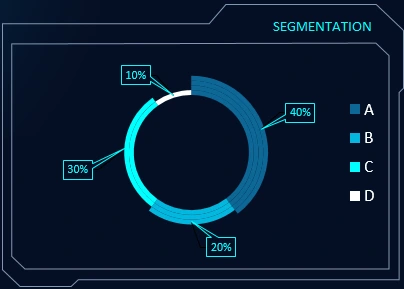
In the bottom-right corner is the “SEGMENTATION” block. Here, a doughnut chart segments the product groups by share. You can see which group has the largest or smallest share of total sales:
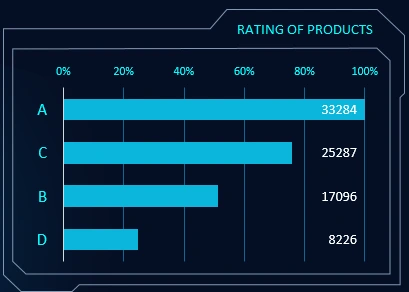
Finally, the top-right block, “PRODUCT RATING,” ranks product groups in descending order by sales performance. It also displays their percentage relative to the top-ranked group:
Together, all blocks and the 3D menu form a dashboard for visual analysis of overall performance metrics — both for the company as a whole and for each of its top five managers:
 Download the Excel Dashboard with 3D Menu
This example clearly shows that without the 3D menu and gamification elements, the dashboard would be quite dull, cold, and monotonous — even with visualization.
Don’t limit yourself to raw calculations. Add visual aesthetics and gamified elements to make work enjoyable. You will immediately notice new levels of productivity and effectiveness.

Data Visualization Charts for Interactive Report Creation in Excel.
Dashboard Templates