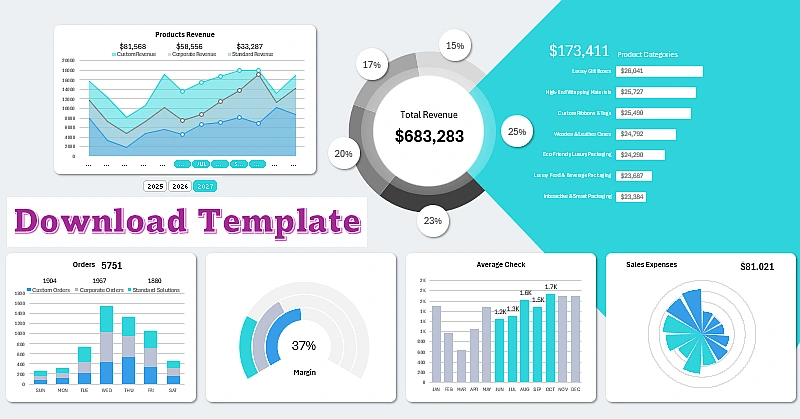
Excel Dashboard for Small Businesses in Premium Packaging
The dashboard is designed to manage the effectiveness of premium packaging’s impact on sales. This Excel dashboard template will be useful not only for small luxury packaging businesses but also for any business in general. Enhance your sales efficiency with our data visualization tools in Excel.
Purpose of the Premium Packaging Dashboard for Small Businesses
Why is this dashboard useful for 99% of entrepreneurs? Many of us have dreamed of owning a small yet prestigious business as an additional or primary source of income—or even gifting it to a loved one. A small and prestigious business is typically a high-margin model.
We live in an era that has already turned the pages of history: from crafts and manufacturing to industrialization. As a result, large corporations with massive budgets have established stable monopolies on mass-market and essential goods. Today, low-margin businesses are nearly inaccessible to small capital, especially considering the ever-increasing complexity of global tax systems. This is why 99% of the population sees no economic sense in low-margin businesses, where profitability relies on large-scale production, high demand, and turnover. However, aspiring entrepreneurs shouldn't be discouraged! This era presents undeniable advantages.
We now live in a world of abundance, where numerous resources are available at relatively low costs, making them accessible raw materials for creation. Given the current landscape, earning potential for modern small projects lies not in selling resources but in selling creativity and unique production.
What defines a high-margin business? Every business is linked to sales, and at its core is the customer. In commerce, margin is almost equivalent to added value. Take books, for example: their production cost includes paper, ink, and covers. However, the creative aspect—the valuable and beautifully presented textual content—far exceeds the production cost. This is what makes it a high-margin product. To broaden the perspective on the vast potential for creative expression, our dashboard example focuses on premium packaging rather than books or paintings.
Interesting Fact! In the luxury perfume industry, packaging accounts for up to 80% of the product's cost.
The variety of information categories in the human world is quite limited. For instance, cinema has only 10 types of storylines. However, the variations in how those stories are presented—just like any other type of information—are limitless! Packaging is a way of presenting a product as information, emphasizing that there is no such thing as expensive or cheap—only profitable or unprofitable. Premium packaging places a product within the context of life, giving it spirit and bringing it to life as it plays a role in our daily experiences. Yes, premium packaging acts like a professional salesperson with vast experience, conveying meaning through its appearance alone. While it may not communicate technical product specifications, that is often unnecessary—since a salesperson’s job is not to educate the customer but to make them happy. Emotion is the first factor driving purchasing decisions, while logic simply justifies them afterward.
Every business needs sales, and the most crucial element of business is the customer, as they are the source of revenue. Packaging has the ability to sell and engage with customers in a way that increases their level of happiness. In fact, every premium package is like a valuable salesperson who continues interacting with the customer even after the purchase, gradually turning them into a loyal client. Statistics show that repeat customers generate 60% of a company's profits.
The dashboard for managing the effectiveness of premium packaging can be viewed as an HR dashboard for sales team management. Since every business needs sales, every business needs packaging, and every business needs a dashboard to monitor the impact of packaging on sales.
Analysis of Premium Packaging Sales Efficiency in Excel
Let’s take a detailed look at the structure of the luxury packaging analysis dashboard in Excel, including each visualization block, its functional purpose, and key usage principles.
Revenue Segmentation by Income Sources
At the center of the dashboard is the primary revenue distribution chart by income sources. The focus is placed on the most important category—products:
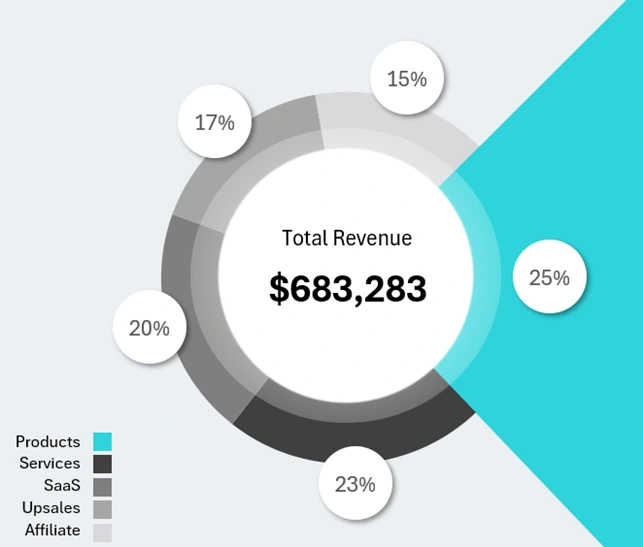
The structure of the central chart combines multiple visualization components arranged in different layers. Some decorative elements are designed using shapes.
Subchart Ranking Packaging Product Categories
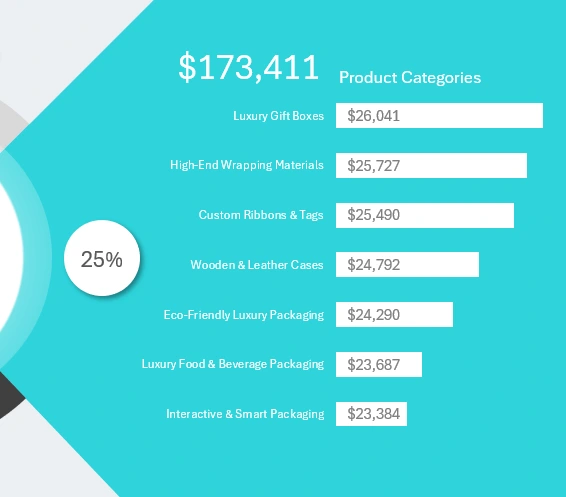
Everything is clear and visually structured here. Products account for 25% of total revenue, amounting to $171,411. All products are categorized into:
- Luxury gift boxes.
- High-quality packaging materials.
- Custom ribbons and tags.
- Wooden and leather cases.
- Eco-friendly luxury packaging.
- Luxury food and beverage packaging.
- Interactive and smart packaging.
Each category has its own revenue share, sorted in descending order. The top-ranked category is likely the flagship product, which serves as the brand’s leading item.
Analysis of Revenue Dynamics for Three Product Types
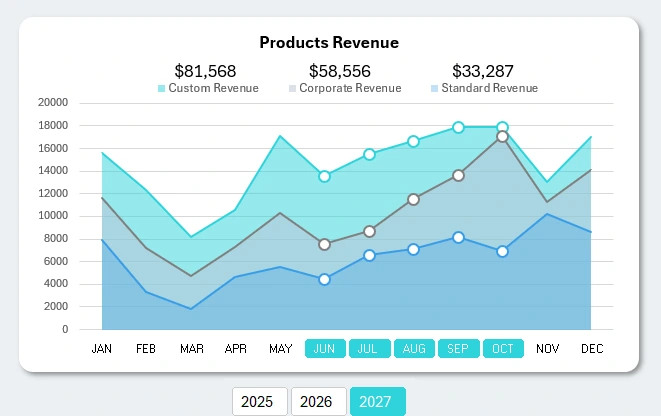
This chart simultaneously analyzes the revenue dynamics for the following three product types:
- Custom-made for individual clients.
- Corporate branding.
- Standard ready-made solutions.
This section also includes dashboard control panel buttons for selecting data based on reporting periods: months and/or years. The buttons are implemented using pivot table slicers, allowing for grouped filtering and multi-selection of data.
Best Days of the Week for Orders
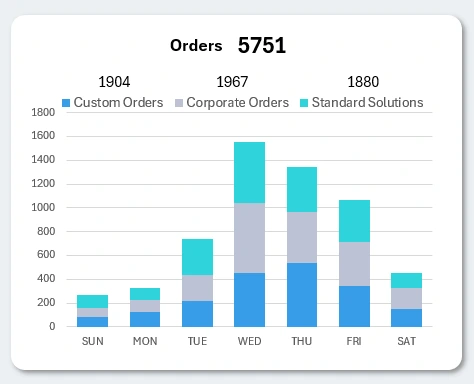
The stacked bar chart presents data on order activity across different days of the week. Furthermore, the accumulation histogram reveals which type of customers place more or fewer orders on specific days.
High-Margin Business Analysis in the Premium Packaging Industry
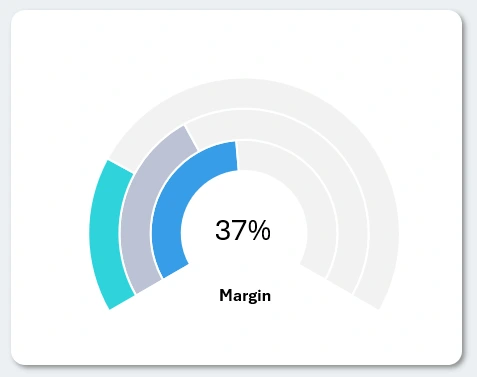
This section displays the margin metric, segmented by three product types. Each product category has its target audience and varying profitability. The center shows the average margin value.
In high-margin businesses, it's important to note that if the margin exceeds 70%, there is a high probability of audits from government authorities, such as tax agencies and antitrust committees. Additionally, remember that margin, unlike markup, cannot be equal to or greater than 100% in relative terms, although in absolute terms, the margin amount may equal the markup amount. Margin represents a share of the product's price and is calculated using a slightly different formula:
Margin always correlates with profit – the higher the margin, the greater the profit. Markup, however, does not always correlate with profit since expenses may exceed income when selling products with a low markup. This is because margin is calculated after deducting the cost, whereas markup is simply a percentage increase over the cost.
Monthly Average Order Value
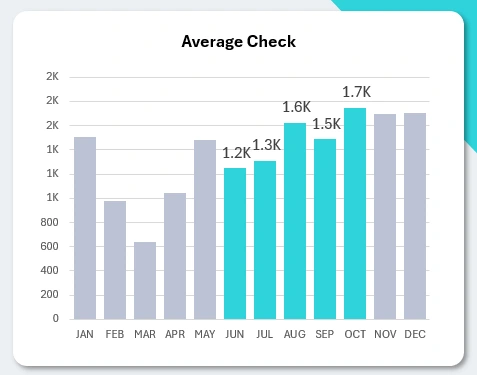
An essential KPI for maintaining and growing the average order value in a high-margin small business. It is crucial to analyze and monitor this metric each month. The average order value may fluctuate significantly due to various factors, such as seasonal sales trends. Monitor it closely to avoid cash flow gaps during off-seasons. It’s wise to build financial reserves and reduce credit obligations.
Monthly Expenses on Product Distribution
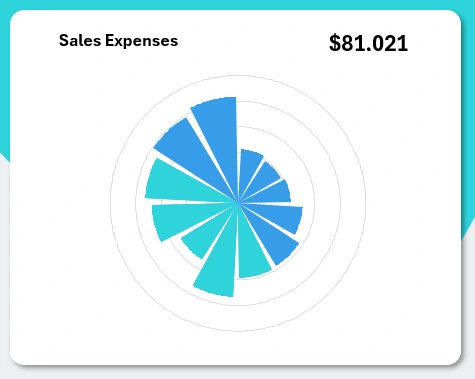
Controlling distribution expenses is essential. This visualization block is presented using a different chart type to maintain visual distinctiveness from the previous section. Aesthetics and design play a crucial role in operational efficiency.
Dashboard Presentation for Small Businesses in the Packaging Industry
Packaging is a high-margin business with consistent demand. Since packaging is typically a consumable item with a limited lifespan, it often needs customization to meet specific client needs. With a robust tool for managing and controlling a small business, complex knowledge isn't required to succeed in this industry. If you have a well-coordinated team, simply reviewing the dashboard daily allows you to track key metrics and oversee business operations efficiently. Entrepreneurs should keep their minds free and always be open to the best ideas.
Download Small Business Dashboard in Excel 
Owning a small yet prestigious business is not just a dream—it is a real opportunity for modern entrepreneurs, even in an era of overconsumption. Remember, in growing markets, every business thrives, but true entrepreneurs can identify growth opportunities even when markets decline. I encourage you to find more advantages and opportunities in these challenging times of excessive consumption. What seems amusing at first may, in reality, be quite serious.

Data Visualization Charts for Interactive Report Creation in Excel.
Dashboard Templates