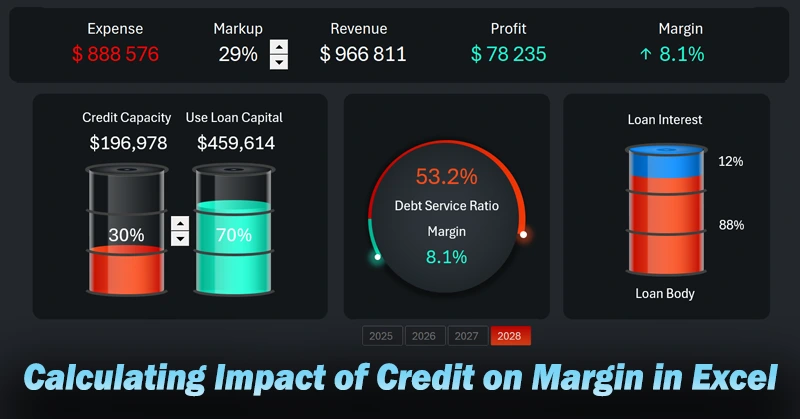
Excel Dashboard to Calculate Impact of Credit on Margin
Credit capital can have both a directly proportional and inversely proportional impact on the margin and profit of a small business. Everything depends on the markup and the loan interest rate. Here is a dashboard to present the effects of using borrowed funds in working capital. This interactive Excel presentation shows how changes in debt load, profit, and profitability are interconnected as markup and the volume of borrowed funds in working capital increase or decrease.
Interactive Excel Presentation for Credit Risk Control
Using borrowed capital always involves risk! But risks can and should be managed, especially in small businesses, to grow margins and profits. To manage risks effectively and in a timely manner, it's helpful to use special tools based on data visualization. Such useful tools can be created in Excel. Risk management is the most important skill to have in business!
A popular sarcastic remark — “If you're so smart, why are you still poor?” — leads us to the question: “What defines wealth?” It's not intelligence or the ability to count money! Otherwise, all the rich would be scientists or mathematicians — but that’s not the case. The skill that defines wealth is effective risk management!
A Simple Example of What Risk Management Is
Most people intuitively believe that “wealth = ideas + action,” not “wealth = loss control.” Many may argue with this fact, but over the long term, fewer critics remain. This was proven by the most successful investor, Warren Buffett, who in 2007 bet $1,000,000 that investing in the most reliable index — the S&P 500 — would outperform five hedge funds from Protégé Partners over a 10-year period (2008–2017).
The result of the bet after 10 years, in 2017:
- S&P 500 (via the Vanguard fund): +125.8%;
- Average result of 5 Protégé Partners hedge funds: +36.3%.
So why does it turn out in practice that in long-term strategies, managing risks effectively is much more important than generating clever ideas or taking persistent action? The basic principle of any business is very simple: sell a product people want to buy so that income exceeds expenses, and reinvest part of the profit to scale up. Understanding this doesn't require much intelligence. Consider the following fact.
Business Profitability Formula:
Profit = Sales Volume * Margin – Customer Acquisition and Service Costs.
Let’s break down all three components of the formula:
- To keep the result positive, it's important to control costs as much as possible.
- Margin increases proportionally as expenses decrease.
- Sales can always be scaled by attracting capital — but only with effective cost control, otherwise rising costs can cancel out the investment impact.
Attracting and obtaining additional capital to increase sales is also easier if you’ve been controlling your costs over a long period. Banks and investors will come to you to offer capital and share in your profits — that’s their primary function.
As shown in all parts of the business profitability formula, the factor of cost control must be considered.
This leads to a logical question: what exactly is risk management? Its formula is even simpler than the previous one:
Risk Management = Cost Control + Sales Control.
Here’s a simplified justification:
- Cost control = protection from loss risks.
- Sales control = protection from dead inventory risks.
- Simplicity of the model = protection from complex failures.
As you can see, even discipline gives you a better chance of wealth than intelligence. So intelligence isn't the top factor among wealthy people. This was proven long ago in ancient Greece by the philosopher Thales of Miletus (c. 624–546 BC). During the winter, Thales rented all the olive presses in the region in advance. When autumn came and the olive harvest began, all the olive oil producers turned to him. Thales made a good profit and concluded that business is simple — you don’t need to be very smart, just capable of managing risks.
Effectively managing borrowed capital = managing risks. If risk management means controlling expenses and sales, what exactly should be done? Especially in small businesses, it's important to regularly analyze key indicators related to using borrowed capital to increase sales:
- monitoring loan servicing expenses;
- monitoring margin and profit levels.
To do this, it's important to regularly use data visualizations in Excel, ensuring timely KPI analysis! Below, we’ll review all the Excel presentation blocks for analyzing the relationship between profit, margin, markup, and borrowed capital.
Mini Dashboard Header with Summary Values
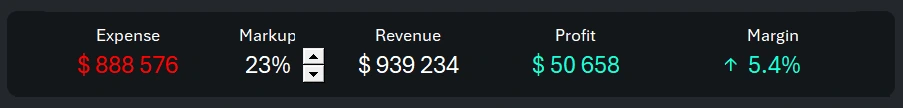
The header of the presentation allows you to analyze summary values based on credit capital usage settings in small businesses.
- Expenses come first.
- Markup level for goods or services.
- Revenue – monitoring sales volume in monetary terms.
- Net profit.
- Margin.
This section includes an interactive control element to adjust the markup. It allows modeling different scenarios of using borrowed funds in working capital.
Managing the Share of Credit in Working Capital
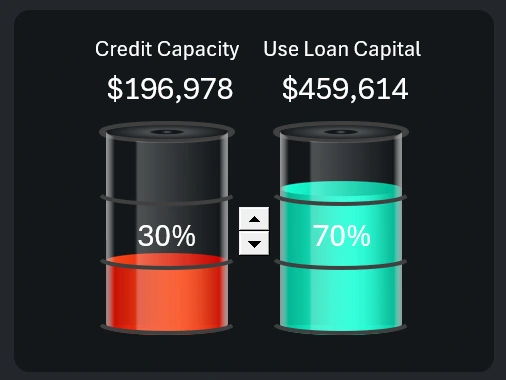
The bottom-left corner of the dashboard includes a control section for adjusting the share of borrowed funds in working capital. Credit always involves risk! If you manage your business effectively, you take on risk gradually. The dashboard allows you to model different credit usage scenarios with varying volumes of borrowed capital — from 0 to 100%.
Using a stepper control, you increase the credit amount and evaluate its impact on the business:
- on expenses,
- on sales volume,
- on profit and margin.
This dashboard section also lets you monitor the level of debt load.
Correlation Between Debt Load and Margin
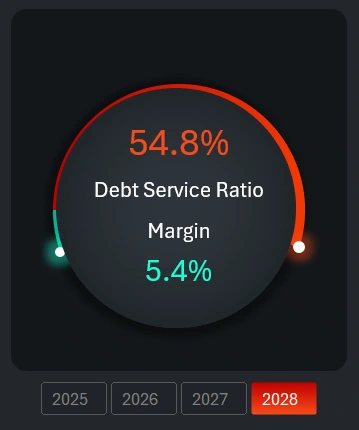
The central visualization block shows how profit margin and debt load are correlated. In any case, as the volume of borrowed funds increases, the debt load rises. But if the strategy is poorly chosen, the margin may decrease. If the strategy is right, the margin will grow proportionally with the increase in debt load. The direction and pace of margin growth, as credit usage increases in working capital, largely depends on the markup. The markup is adjusted in the dashboard header.
Still, no matter how high the margin is, the maximum allowable level of debt load for a small business should not exceed 60%! Otherwise, even small unforeseen risks can lead to bankruptcy.
Ratio of Interest to Principal
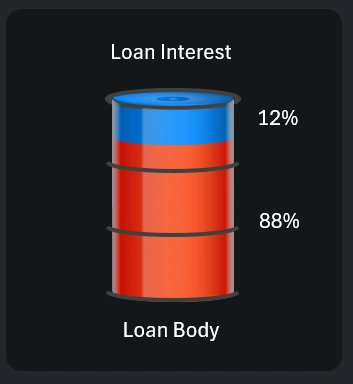
No matter how successful the business is, it's always important to monitor credit repayment costs. The principal covers the cost of production and delivery, while interest can only be covered from a portion of the profit. Under no circumstances should the markup percentage be equal to or lower than the loan interest rate. Otherwise, margin and profit will turn negative.
Mini Dashboard to Assess the Impact of Credit on Business Profit
Ideally, a business is fully self-sufficient and can grow without using loans. But in the real financial world of modern business competition, that is only possible short-term under favorable conditions. Effective crisis managers, even if they don’t use credit capital, at least maintain creditworthiness potential for emergencies. Also, the risk of missed profit from unexpected opportunities is a real risk, too! Analyze your small business’s financial environment efficiently — and more importantly, in a timely manner — by using data visualization tools in Excel:
Download the mini dashboard template to analyze credit impact in Excel 
These simple but powerful data visualization tools in Excel help you work efficiently and with satisfaction. Data visualizations are easier to perceive, read, and remember than plain tables. Moreover, working with visualizations fosters creativity and inspiration. Boring tables are not meant for quick analysis — they usually only cause frustration at best.

Data Visualization Charts for Interactive Report Creation in Excel.
Dashboard Templates