Download Excel Dashboard Cryptocurrency Portfolio Tracker
We present to you a dashboard template for visual analysis of a cryptocurrency portfolio. The cryptocurrency portfolio tracker is designed for comfortable tracking of key indicators that have the greatest impact on your investments.
Data Visualization for Cryptocurrency Tracking in Excel
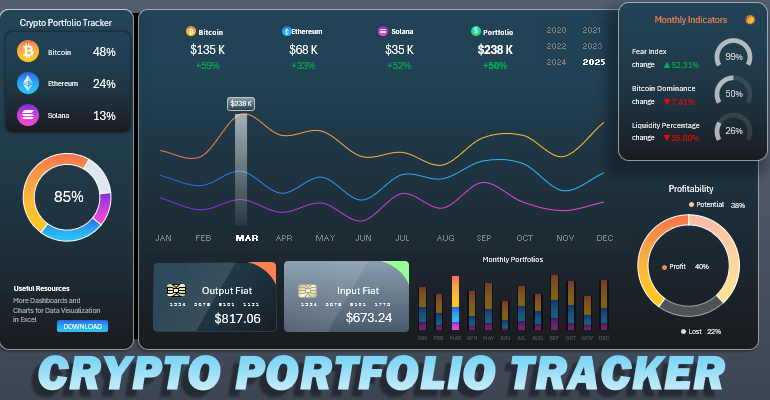
The dashboard consists of visualization blocks for cryptocurrency asset metrics. The final values are displayed in US dollars.
Asset Allocation in the Portfolio by Shares
The first block on the right is intended for visualizing the portfolio's asset allocation by cryptocurrency shares, as well as the overall percentage of the planned portfolio size that has been filled.
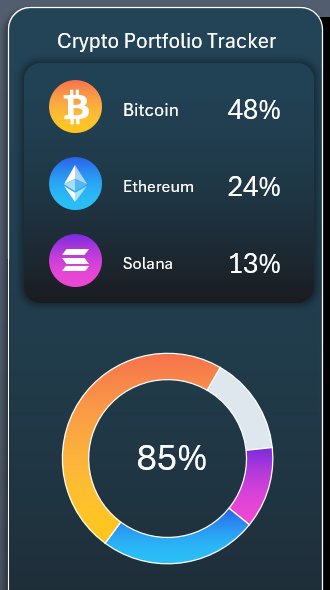
It's worth noting right away that this is where the dashboard control button block is located. Clicking on one of the coins toggles the display of the selected coin's metrics on the dashboard.
Metric Dynamics as a Basis
The large area in the center of the template is a line chart for comparative analysis of the dynamics of cryptocurrency asset volumes by month for the selected year.
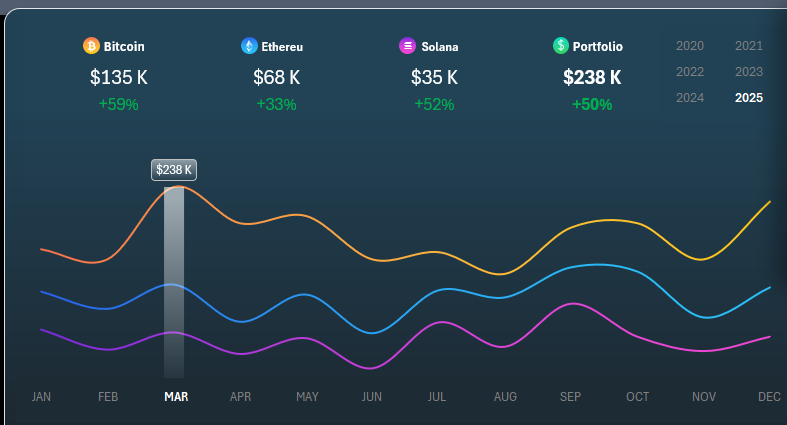
The block contains the final monthly metrics for each coin and the portfolio as a whole. There are also two blocks of dashboard control buttons here. In the upper right corner, you can switch between years. The labels on the X-axis of the line chart also function as buttons to switch between months.
Fiat Deposits or Withdrawals
Below are two bank cards with the final amounts for fiat deposits and withdrawals to and from the cryptocurrency portfolio.

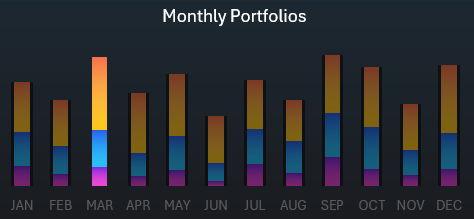
Next to it is a clustered bar chart visualizing the shares of assets in the portfolio for each month.
Monthly Portfolios
In the upper right corner, there is a block of key market indicators for a specific accounting period.
Monthly Indicators
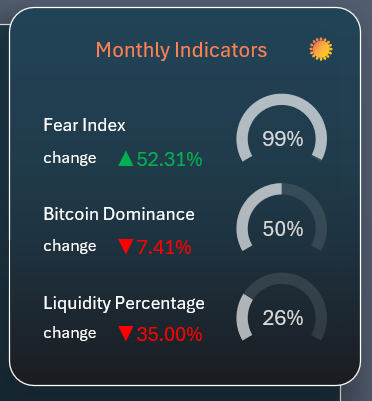
- Fear Index – measures the level of fear and shows how much investors are afraid that the market may crash.
- Bitcoin Dominance – shows the share of Bitcoin in the total market capitalization of the entire cryptocurrency market. In other words, how much of the entire cryptocurrency market Bitcoin occupies compared to other cryptocurrencies (altcoins).
- Liquidity Percentage – the percentage ratio of the trading volume of the crypto portfolio to its market capitalization or total supply volume.
There is also another button in the upper right corner to toggle the dashboard's display mode between day and night, represented as a sun icon.
Portfolio Profitability
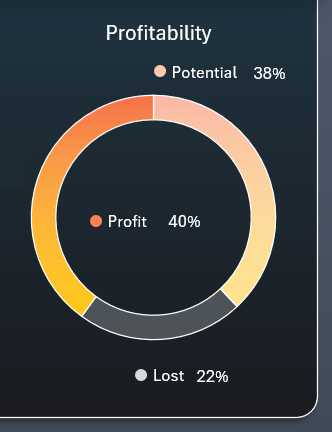
A diagram for estimating the portfolio's approximate profitability, considering the potential for growth and the amount of missed profit in the current month.
Source Formulas for Charts and Graphs
The "Processing" sheet contains the formulas for processing the source values that should be filled in the table on the "Data" sheet. The core process embedded in the formula algorithms is data extraction based on multiple criteria. The extraction is implemented using a formula that combines the INDEX and MATCH functions with the CONCATENATE function.
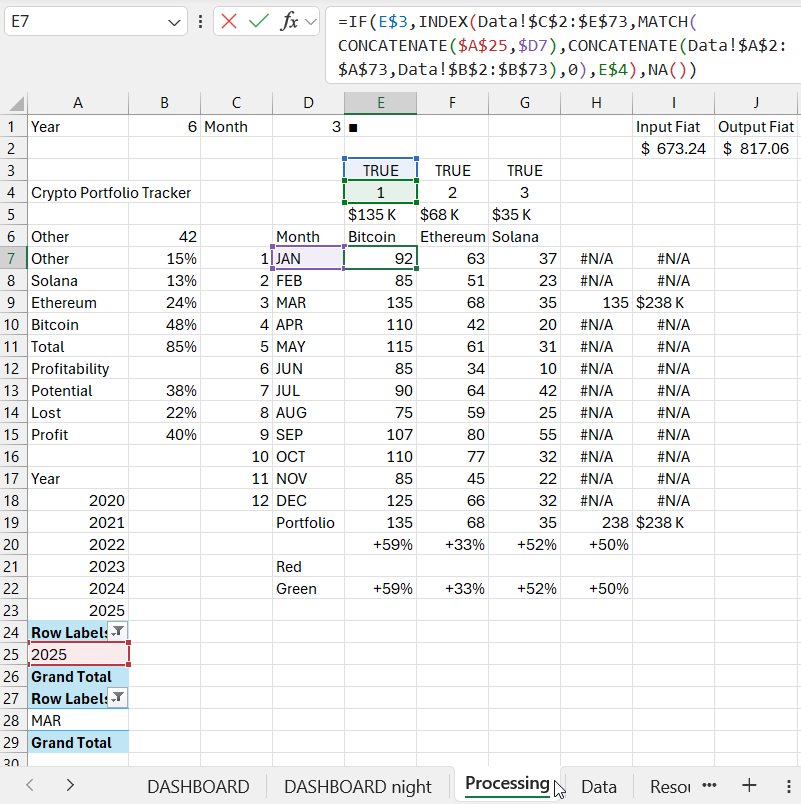
The template has been simplified as much as possible for easy and quick understanding of its functionality.
Presentation of the Cryptocurrency Portfolio Tracker
The template was created as an example of how Excel can be useful in the field of portfolio investment visualization.
Download the cryptocurrency portfolio tracker template in Excel 
This template includes only the top 3 cryptocurrencies. You can expand and modify it to suit your needs. No macros are used—everything is done simply with basic Excel tools and formulas.
