Download an Interactive Developer Roadmap Charts in Excel
A roadmap is a strategic path that helps organize development and achieve results for both primary and intermediate goals—not just for developers. Visualizing a roadmap provides confidence in the effectiveness of your intentions. Excel allows you to create an interactive roadmap to enhance its functionality in project development management analysis.
Benefits of a Roadmap for a Developer's Project Presentation
In business, as in any project, the key to success is the ability to stay focused on completing critical tasks. A roadmap helps developers avoid chaos and uncertainty by providing a clear sequence of steps toward achieving successful results.
Awareness of deadlines is especially useful in maintaining focus. In our world, the complexity of any task is primarily determined by time. The value of the final result also heavily depends on time. But with a roadmap, you can manage your time by breaking it into achievement stages. This improves a developer's time management, turning a chaotic list of task requests into an organized sequence.
A developer's roadmap is essential for both drafting technical specifications and analytically monitoring their execution. This planning approach not only brings peace of mind to entrepreneurs in their actions and decisions but also reassures investors and clients. That’s why today, every project presentation should include a roadmap. Adding interactivity significantly increases its value as a tool.
How to Create a Stunning Roadmap in Excel Using PowerPoint?
To make a presentation more engaging, it needs to be visually striking. Achieving this requires using complex shapes as enhancements for charts and diagrams in Excel. The best way to create such shapes is in MS PowerPoint, which offers advanced shape editing features not available in MS Excel:
- Shape merging.
- Combining.
- Fragmenting.
- Intersecting.
- Subtracting.
These tools enable the creation of complex shapes with cutouts, which can be used to create a masking effect—overlaying a shape with cutouts onto a chart to reveal specific data areas based on user-defined conditions. This expands Excel’s data visualization capabilities, achieving previously unavailable presentation results.
3D Roadmap in Excel
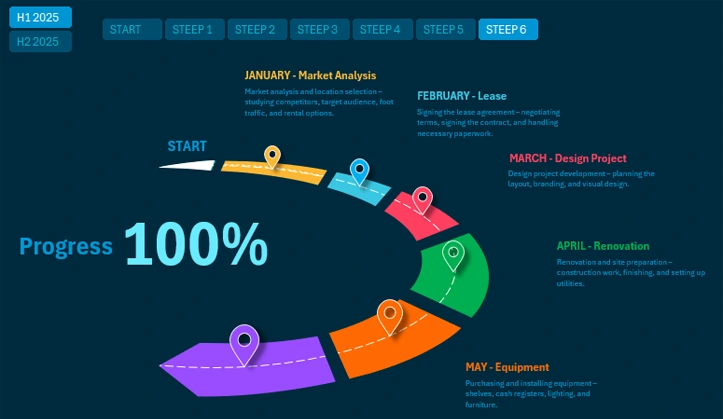
Download the 3D Roadmap Template in Excel 
The first example demonstrates how to effectively present a six-month plan in Excel. By leveraging PowerPoint’s editor within Excel, we created a beautiful interactive roadmap with a 3D effect. This bold design is sure to capture attention and stand out from standard competitor presentation templates. Boldness and aesthetics always evoke positive emotions, which strongly contribute to sales.
The interactive 3D roadmap allows users to toggle between the first and second half of the year within a single data visualization template. It also includes buttons to display completed tasks over different time periods. Additionally, it allows for the visual separation of tasks yet to be completed in the coming months. Download the template and customize it as needed to build roadmaps for other reporting periods, such as quarters, seasons, or semesters.
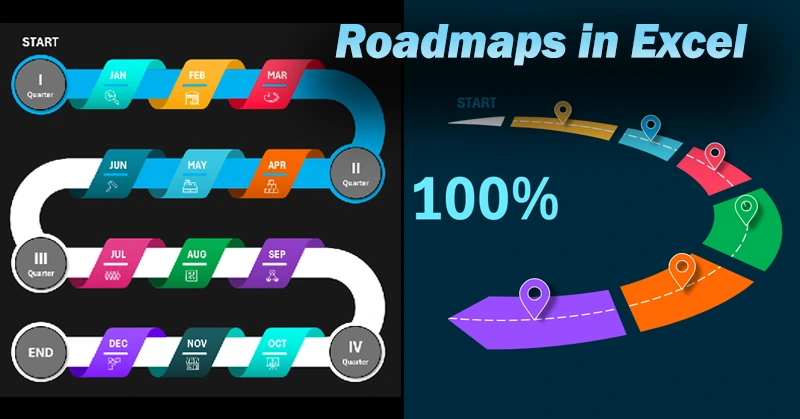
Developer Roadmap with Quarterly Segmentation
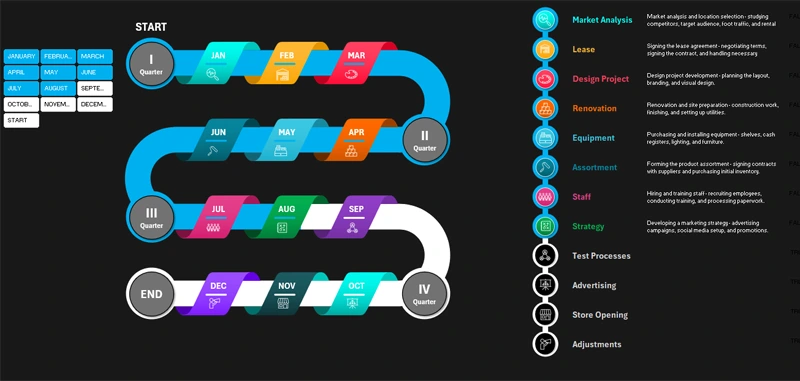
Download the Interactive Developer Roadmap in Excel
The second example features an even more practical design. Here, interactive visualization functions allow users to highlight and separate completed and pending intermediate tasks along the path to the final goal. However, this roadmap is designed for long-term annual planning. To simplify both data perception and analytical deadline tracking, the year is divided into four quarters—a widely used reporting period, not just in accounting.
How do you eat a whale? One bite at a time! This approach is not only more efficient but also more enjoyable. Any large, complex task can be broken down into smaller, simpler subtasks—this is called project decomposition.
MS Excel enables the creation of highly functional presentations without using macros, but it benefits greatly from the advanced shape editing capabilities of MS PowerPoint. This isn’t a comparison of the two programs—they each serve distinct purposes. Instead, this demonstrates the advantages of their synergy. When used together harmoniously, MS Excel and MS PowerPoint achieve far greater results.

Data Visualization Charts for Interactive Report Creation in Excel.
Dashboard Templates