Excel Infographic Big Mac Index with Borscht Set Pricing
The well-known Big Mac Index is an unofficial indicator for assessing purchasing power parity of different currencies across countries. The index is based on the price of the iconic McDonald's Big Mac burger, available worldwide. The Big Mac Index is calculated using a special formula. However, there are other unofficial economic indices, such as the Borscht Set Index, which aims to measure the real inflation rate. It operates on a completely different principle, arguably more effective, as it considers the prices of individual ingredients rather than a final product. While Borscht (originating in Ukraine) is less globally popular than the Big Mac, the Borscht Set Index is undervalued. Let’s address this gap by using an Excel interactive presentation to calculate the Big Mac Index based on the principles of the Borscht Set Index.
Big Mac and Borscht Set Index Calculation Formulas
How to calculate the Big Mac Index? Start by obtaining local currency prices of Big Macs for each country and convert them into USD. Then, compare these prices to the Big Mac price in the US (e.g., $5) and calculate the deviation.
Big Mac Index Formula:
The Borscht Set Index allows us to determine the real purchasing power of a country’s currency considering inflation factors. Here's how it's calculated:
Key Borscht Set Components:
- Vegetables: potatoes, cabbage, beets, carrots, onions.
- Meat: beef or pork.
- Additional Ingredients: tomato paste, garlic, cooking oil, herbs (dill, parsley), sour cream.
Average market prices for all ingredients are calculated, summed, and compared across periods. With zero inflation, the difference should be zero.
Borscht Set Index Formula:
The Borscht Set Index accurately estimates inflation and provides insight into purchasing power within a country relative to its own currency. While it cannot yield a perfect inflation measure, it offers valuable real-world data.
Infographic: Big Mac Index Using Borscht Set Principles
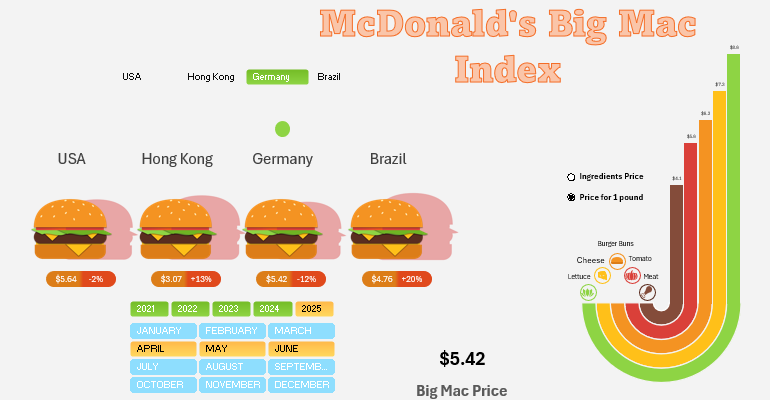
This presentation applies the Borscht Set formula to the Big Mac Index. The dashboard includes:
- Infographics for comparative price analysis across countries.
- A vertical bar chart for comparing ingredient costs.
- Dashboard controls for interactivity.
In the center is an interactive chart comparing Big Mac prices in four countries:
- USA
- Hong Kong
- Germany
- Brazil
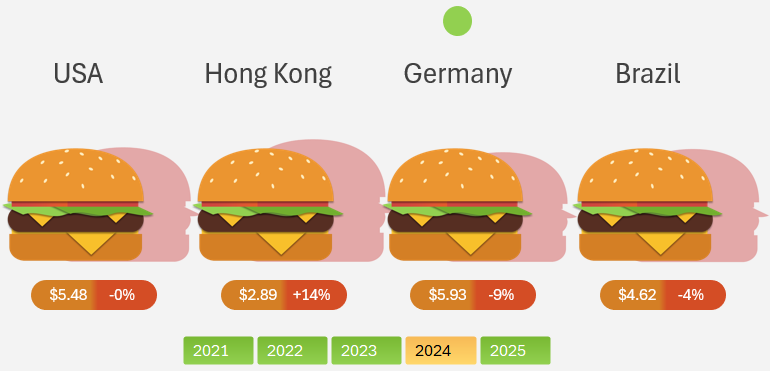
The interactive chart adjusts as data selection changes. Overall, this dashboard effectively visualizes inflation-adjusted purchasing power and product pricing analysis.
The vertical bar chart on the right analyzes key Big Mac ingredient costs:
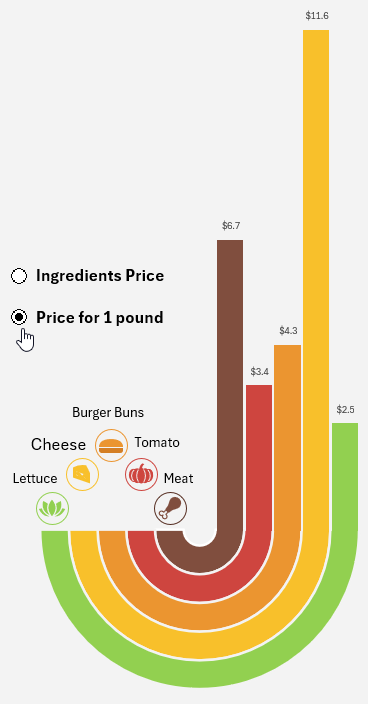
- Beef patty
- Tomatoes
- Burger buns
- Cheese
- Lettuce
The histogram includes a toggle feature, allowing you to present market prices of these products per pound or display their actual share of the burger's cost. According to the ingredient cost distribution table for the burger:
| Ingredient | Burger Cost Share |
| Beef Patty | 40% |
| Tomatoes | 15% |
| Burger Buns | 20% |
| Cheese | 15% |
| Flying Lettuce | 10% |
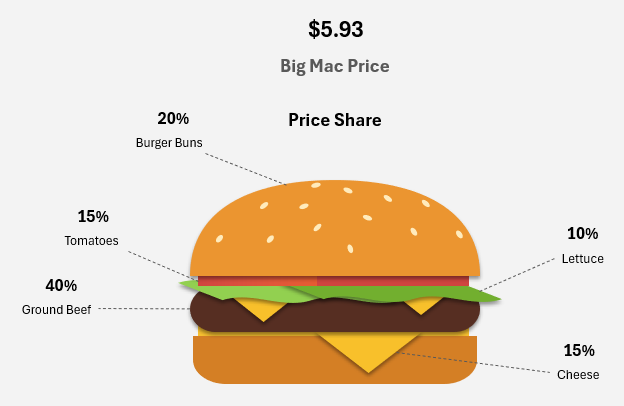
When switching to product prices per pound, the most expensive ingredient is cheese. However, switching to the share of the ingredient in the burger's cost, the largest expense is for the beef patty. While a pound of ground beef is cheaper than a pound of cheese, the burger uses much more beef than cheese.
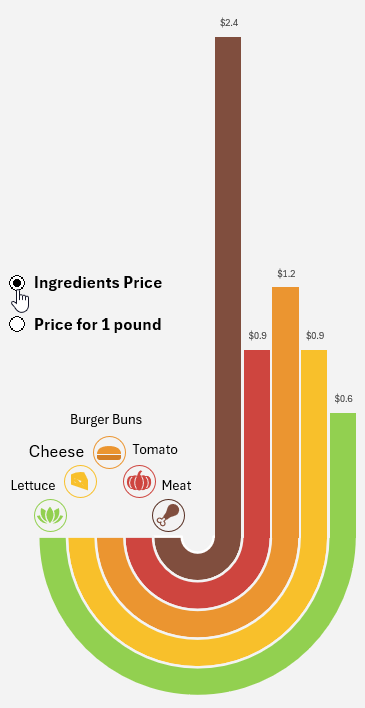
Switching between countries adjusts the histogram of ingredient product prices accordingly. Similarly, changing data selection criteria for the accounting period updates prices as well.
The experiment proved entirely worthwhile, as this dashboard with infographics can effectively argue for clarifying the actual inflation rate—rather than the one reported in the news or shown on TV.
Download the Big Mac Index Infographic Excel Template 
The official inflation rate published by the U.S. Bureau of Labor Statistics often significantly differs from the inflation rate reflected in grocery costs for an average U.S. citizen—typically, the latter is higher.
Additionally, the interactive product pricing presentation for the Big Mac ingredients can be useful for corporate reports.
