FORECAST Excel Formula for Sales Prediction with Seasonality
The main goal of deseasonalizing data is to forecast future sales trends. Deseasonalized data, combined with the FORECAST function, provide the necessary information to predict sales volumes for the upcoming year.
Example of Excel Table Formulas for Sales Forecast Analysis
The image below shows the original data. Let's assume you need to create a sales forecast for the year 2020, even though the available statistical data only goes up to December 2019. The first step is to use the FORECAST function to extend the deseasonalized data by 12 months. The formulas in the tables are as follows:
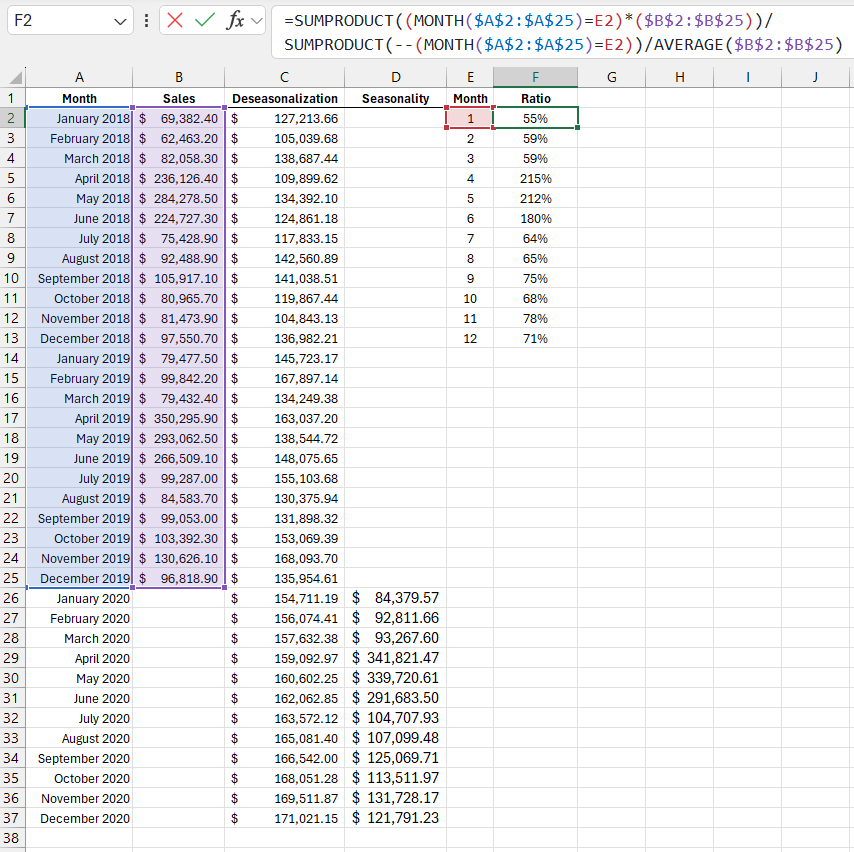
- Calculation of the seasonality coefficient for each month of the year:
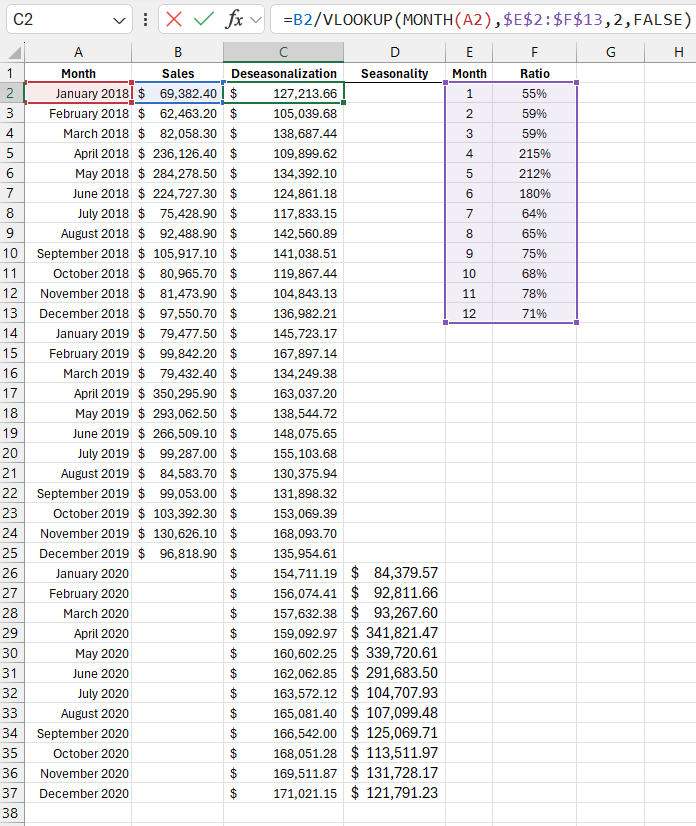
- Deseasonalization calculation based on the coefficients:
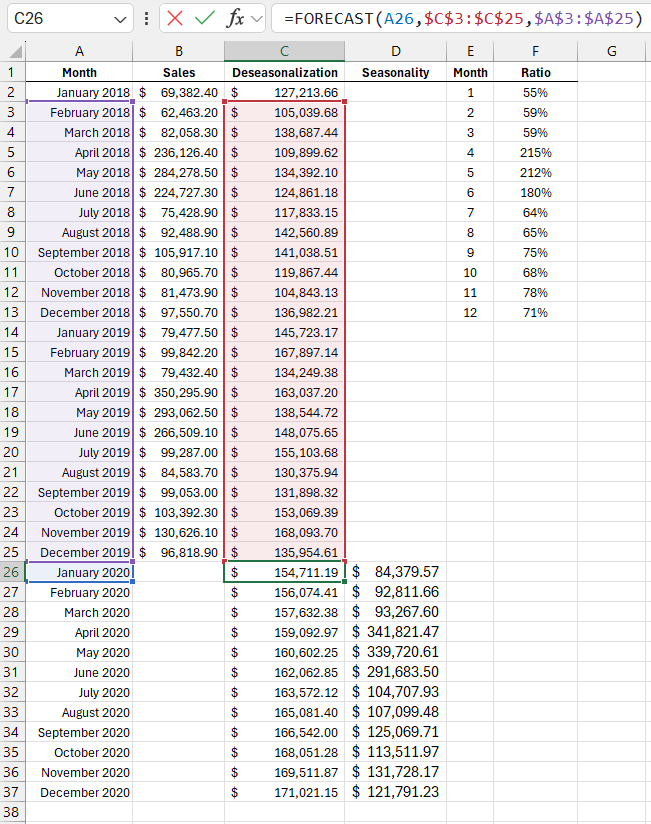
- The formula for predicting sales for January 2020 is located in the same column in cell C26 and looks like this:
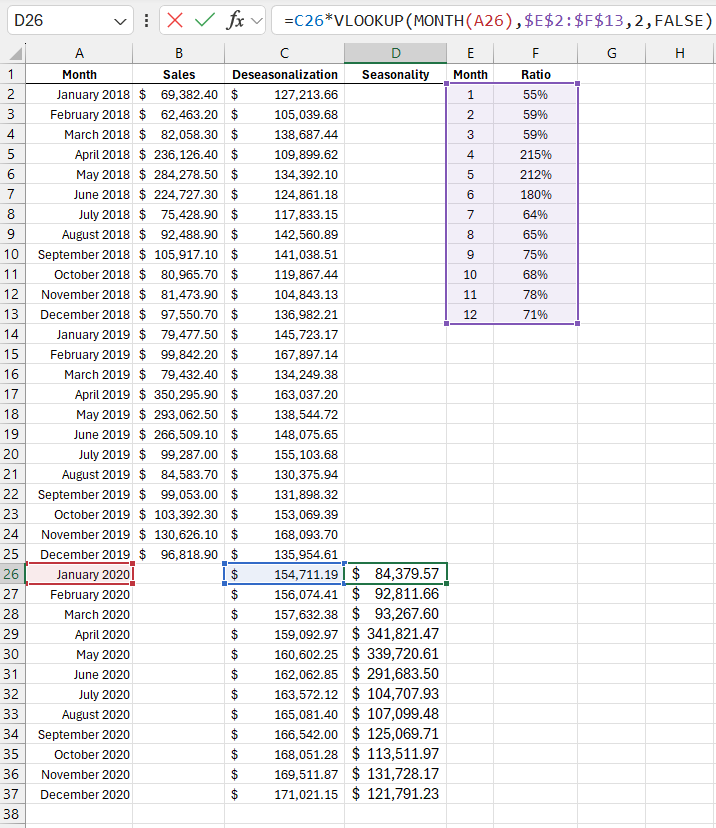
- The formula for forecasting seasonality for 2020:
=SUMPRODUCT((MONTH($A$2:$A$25)=E2)*($B$2:$B$25))/SUMPRODUCT(--(MONTH($A$2:$A$25)=E2))/AVERAGE($B$2:$B$25)
=B2/VLOOKUP(MONTH(A2),$E$2:$F$13,2,FALSE)
=FORECAST(A26,$C$3:$C$25,$A$3:$A$25)
=C26*VLOOKUP(MONTH(A26),$E$2:$F$13,2,FALSE)
The FORECAST function uses linear regression to predict future values. It has 3 arguments:
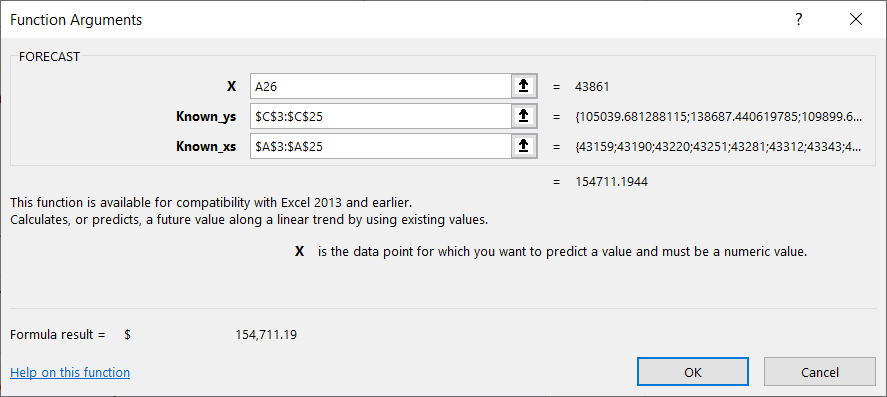
- X – This argument specifies the month for which the forecasted value is to be calculated.
- Known Y values – This argument contains the deseasonalized data from column C.
- Known X values – This contains the months corresponding to the sales data in column A.
Once you have created the forecasted values for all the months using the FORECAST function, you need to restore the seasonality by applying the coefficients from the table shown in the previous image.
Sales Forecast Chart with Seasonality
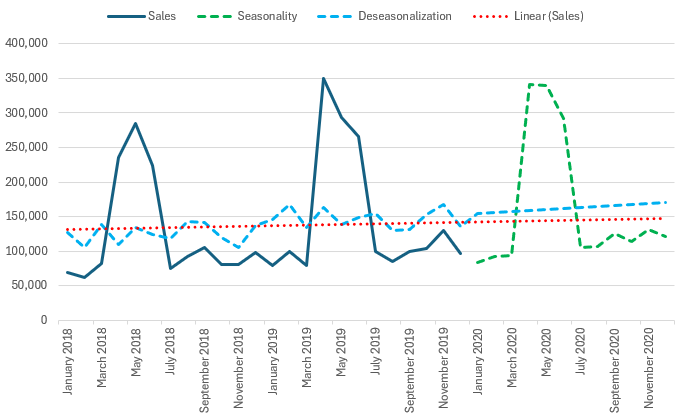
After performing all calculations and obtaining the necessary data, you can create a sales forecast chart with seasonality for the upcoming year:
Download Sales Forecast with Seasonality in Excel 
Restoring seasonality data involves reversing the deseasonalization process by multiplying the forecasted values by the seasonality coefficients. For example, as the statistics indicate that January sales are 53% of the average value, the forecasted sales figure for January is multiplied by the 53% coefficient to calculate the final sales forecast for the month. The chart below shows the forecasted data.
Read the previous article: Example of a Formula for Sales Deseasonalization in Excel
After restoring seasonality, you can observe an active forecasted growth in the second quarter.
