Calculation of the moving average in Excel and forecasting
Practical modeling of economic situations implies the development of forecasts. You can implement such effective forecasting methods using Excel tools like exponential smoothing, regression construction, moving average. Let’s consider the use of the moving average method in more detail.
Use of moving average in Excel
How to Calculate Exponential Moving Average in Excel.
The moving average method is one of the empirical methods for smoothing and forecasting time-series. The essence: the absolute values of a time-series change to average arithmetic values at certain intervals. The choice of intervals is carried out by the slip-line method: the first levels are gradually removed, and the subsequent levels are switched on. As a result, a smoothed dynamic range of values is obtained which makes it possible to clearly trace the trend of changes in the parameter.
The time-series is a set of interconnected values of X and Y. X are time intervals and constant variable. Y is a characteristic of the occurrence under investigation (for example, a price which running in a certain period of time) and it is the dependent variable. You can identify the nature of changes in the value of Y in time and predict this parameter in the future using the moving average. The method works when the trend for the values is clearly traced in the dynamics.
For example, you need to forecast sales for November. The analyst selects the number of previous months for analysis (the optimal m number of the moving average members). The forecast for November will be the mean of the parameters for m previous months.
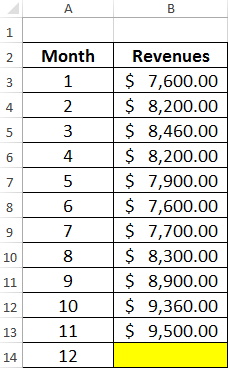
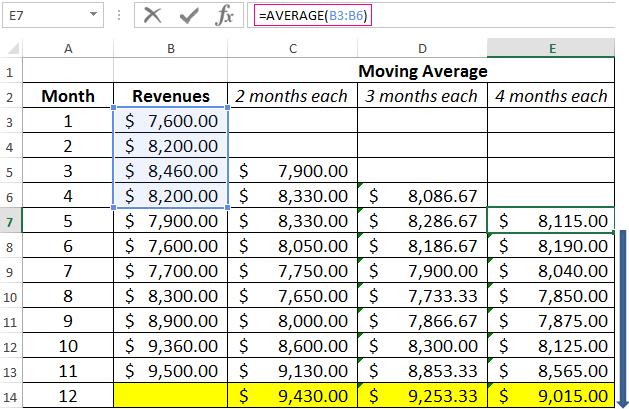
Task. Analyze the company's revenue for 11 months and make a forecast for the twelfth month.
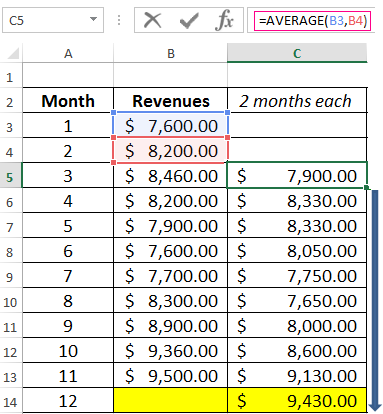
We will form the smoothed time series by the moving average method using the function AVERAGE. We find the midle deviations of the smoothed time series from the given time series.
- We construct a smoothed time series using the moving average method for the previous 2 months. We based on the values of the initial time series. The moving average formula in Excel. Copy the formula to the range of cells C6:C14 using the autocomplete marker.
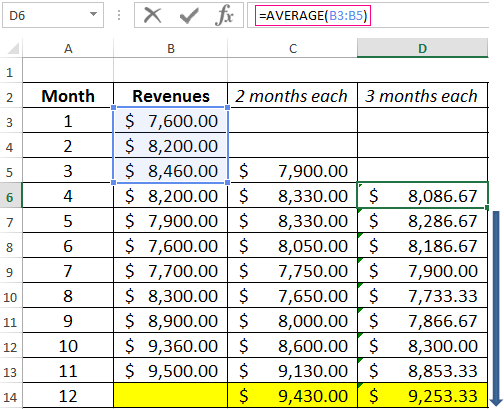
- Similarly, we build a series of values for a three-month moving average. The formula is next:
- By the same principle, we form a series of values for the four-month moving average.
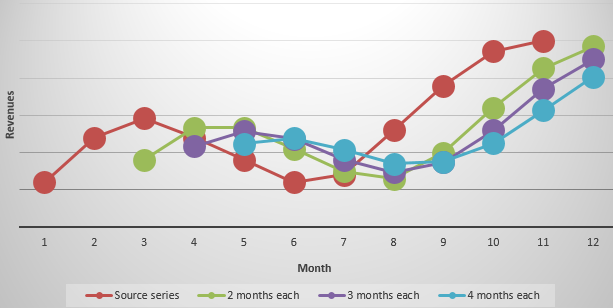
- Let's construct the chart for the given time series and the calculated forecasts based on its values for this method. The figure shows that the trend lines of the moving average are shifted relative to the line of the original time series. This is because the calculated values of the smoothed time series are delayed compared to the corresponding values of the given series. After all, the calculations were based on the data of previous observations.
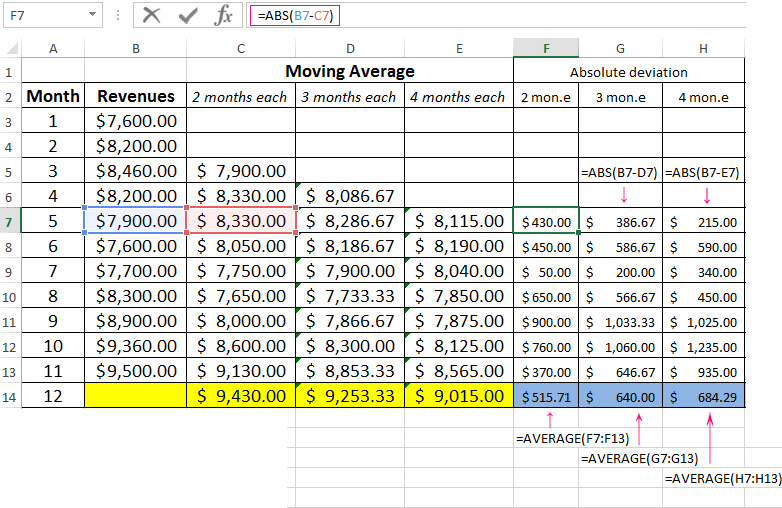
- Let’s calculate the absolute, relative and mean square deviations from the smoothed time series. Absolute deviations:
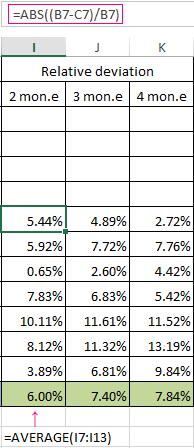
Relative Deviations:
Mean square deviations:
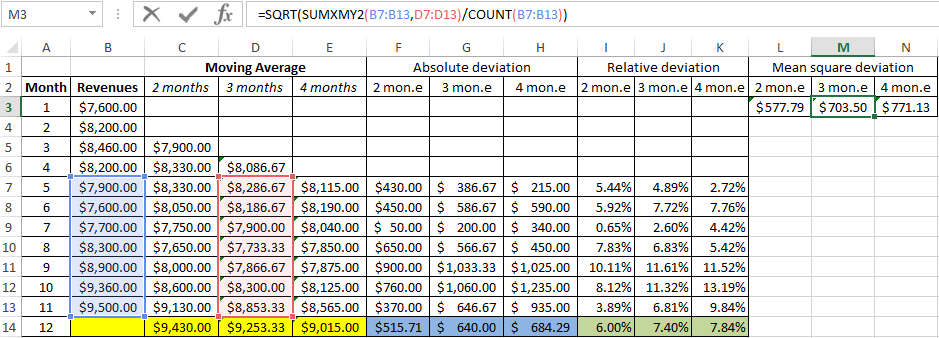
The same number of observations were taken while calculating deviations. This is necessary in order to carry out a comparative analysis of errors.
After comparing the tables with deviation it is preferable to use the model of a two-month. It's the better way to make a forecast the trend of changing the company's revenue using the moving average method in Excel. It has minimal errors in forecasting (in comparison with three and four-month).
The forecasted revenue for 12 months is 9 430$.
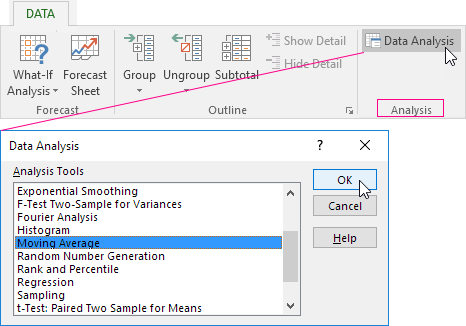
Using the "Data analysis package" add-in
Let’s take the same task for this example.
On the "DATA" tab we find the "Data Analysis" command. Select "Moving Average" in the appeared dialog:
Let’s fill all the fields. Input interval is the initial values of the time series. Interval is the number of months included in the moving average calculation. Enter the number 2 in the field since we will first build a smoothed time series based on the data of the two previous months. The output interval is the range of cells for deriving the results.
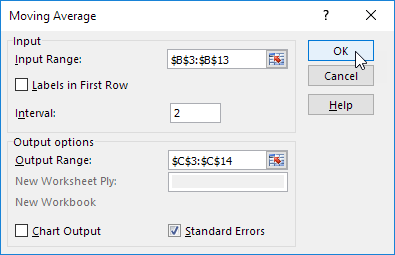
We automatically add a column to the table with a statistical error estimate by putting a check mark in the "Standard errors" box.
In the same way, we find the moving average for three months. Only the interval (3) and the output range are changed.
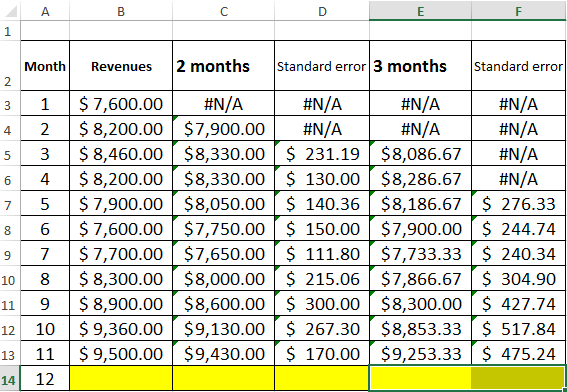
We are convinced after comparing standard errors that the model of a two-month moving average is more suitable for smoothing and forecasting. It has smaller standard errors. The forecasted revenue for 12 months is 9 430$.
Download the moving average calculation in Excel
Making forecasts using the moving average method is simple and effective. The tool accurately reflects changes in the main parameters of the previous period. But it is impossible to go beyond the limits of known data. Therefore, other methods are used for long-term forecasting.

Data Visualization Charts for Interactive Report Creation in Excel.
Dashboard Templates