Exponential Smoothing Method for Moving Average in Excel
The moving average is an excellent method for smoothing data. However, its main drawback is that each value in the original data set is given equal weight. For example, in a six-week moving average, each week's value is assigned a weight of 1/6. For some statistical data, more recent values are often more relevant, and thus should be given more weight. Exponential smoothing addresses this issue by assigning greater weight to the most recent data. This resolves the statistical problem.
Formula for Calculating Exponential Smoothing in Excel

Exponential Moving Average Excel formula.
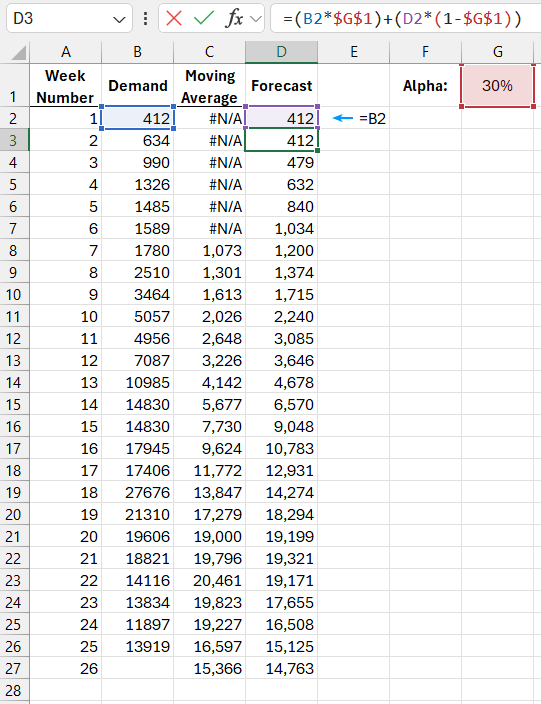
Below is an image showing a report of demand for a specific product over 26 weeks. The "Demand" column contains information on the quantity of the product sold. In the "Forecast" column, the formula used is:
=(B2*$G$1)+(D2*(1-$G$1))

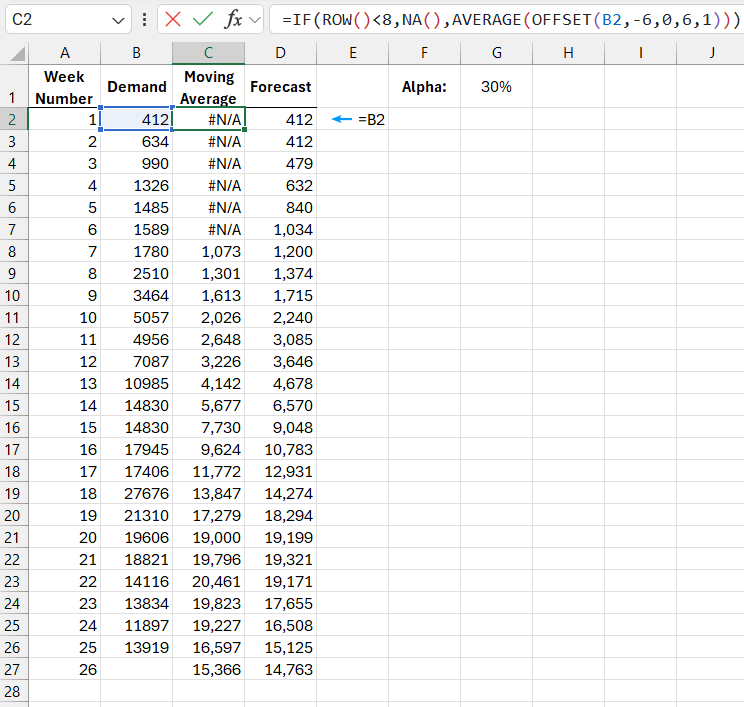
In the "Moving Average" column, the forecasted demand is determined using the traditional moving average calculation over a 6-week period:
=IF(ROW()<8,NA(),AVERAGE(OFFSET(B2,-6,0,6,1)))

In the last column, using the formula described above, the exponential smoothing method is applied, where the most recent weeks' values are given more weight than the previous ones.
The "Alpha" coefficient is entered in cell G1, representing the weight assigned to the most recent data. In this example, it is set to 30%. The remaining 70% of the weight is distributed among the other data. For instance, the second most recent value (from right to left) is assigned 30% of the remaining 70% weight – or 21%, the third value receives 30% of the remaining 70% – or 14.7%, and so on.
Exponential Smoothing Graph
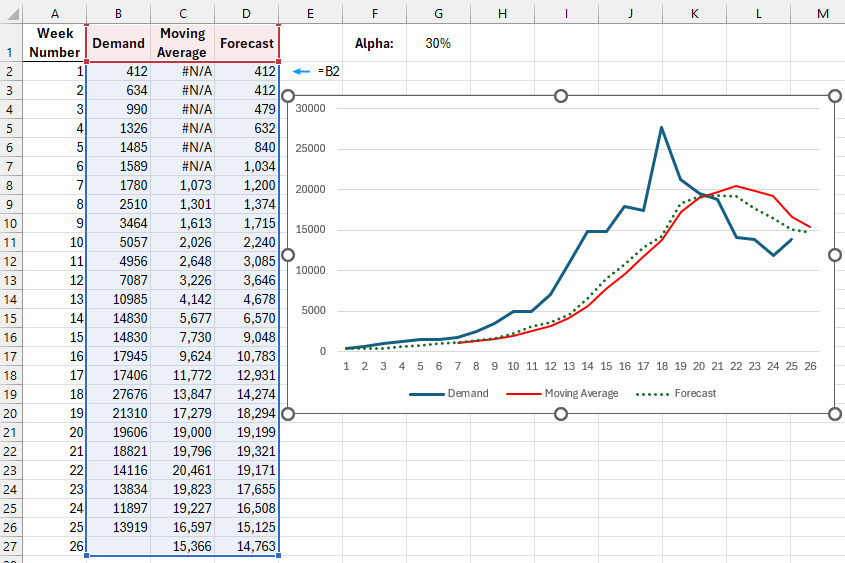
Below is an image of the demand graph, showing the moving average and the forecast using the exponential smoothing method, which is based on the original values:

Download the Example of Exponential Smoothing Method for Moving Average in Excel 
Notice that the forecast using exponential smoothing responds more actively to changes in demand than the moving average line.
The data for the previous weeks are multiplied by the alpha coefficient, and the result is added to the remaining percentage weight multiplied by the previous forecasted value.
See also: Data Smoothing Formula Using the Moving Average Method in Excel
The older the demand data, the less influence it has on the forecast calculated using the exponential smoothing method. In other words, demand data from the last week is more important than data from the previous week.
