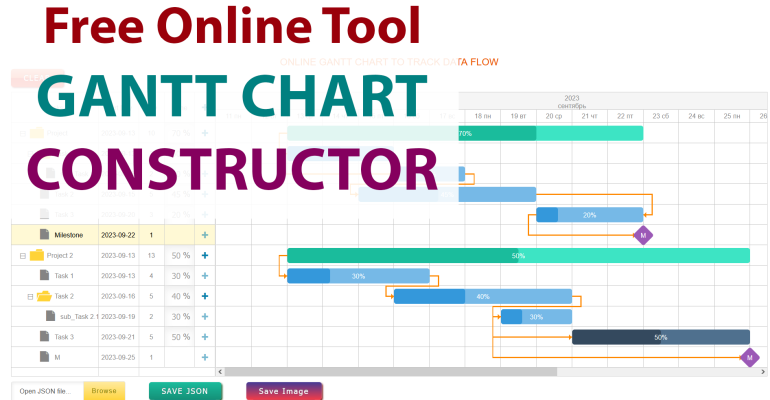
How to use Gantt Chart to visualize data flow online
A Gantt chart is an indispensable tool for planning and decomposing project structures. They are often used not only by strategic managers but also by ordinary programmers who need to subdivide tasks into subtasks in abstract anticipation of the future result. For example, it is very useful for analyzing and creating a logical chain of scenarios in Technical Specifications.
Free Gantt chart for visualizing data flow online
Every working project is a composition of sequentially merged tasks, resulting in a harmonious whole. The most complex project can always be broken down into simple tasks. There are no complex tasks; there can only be convoluted tasks. It is also important to use the Gantt chart for this purpose. Nothing is a plan - planning is everything.
An example of using the Gantt chart constructor is shown in the video:
Time is an essential condition in building visualizations for analyzing project implementation processes. Deadlines determine the level of complexity in implementing any project. If we lived forever, there would be no difficulty in achieving any goal. In a mirror example, let's quote Einstein, who said, "If I had only 2 hours to save the world, I would spend 1 hour and 55 minutes analyzing the problem and only 5 minutes on its implementation."
Deadlines are what turn desires into goals, and that's how a plan for achieving them is born. To assess the usefulness of a Gantt chart for project managers, it is enough to briefly describe the instructions for use.
Instructions for Using the Gantt Chart Online
First, define the project's implementation period to turn desire into a goal. Let's say 7 days for implementation.
To turn a goal into a plan, break down the process of achieving it into simple tasks. How to eat a big whale? - Bit by bit, it's even tastier. This children's riddle encapsulates the essence of the art of small steps - we break down complex tasks into simple ones and, most importantly, enjoy the process.
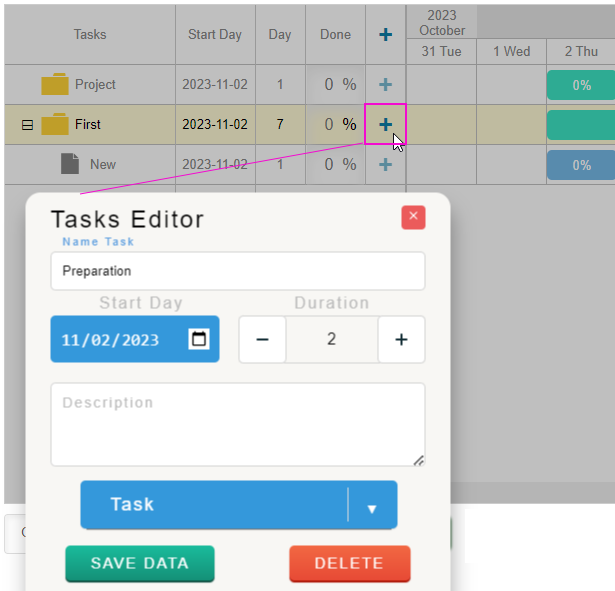
To add a new project or task, use the plus icon "+":
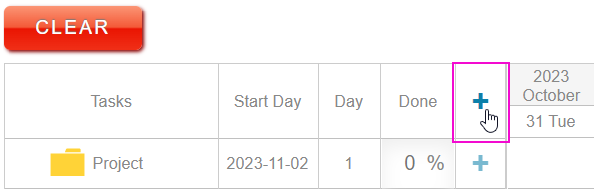
It's worth noting right away that when choosing which plus button to press, we determine the level of nesting. The number of nesting levels is unlimited.
In the "Tasks Editor" dialog box that appears, we set all the necessary parameters:
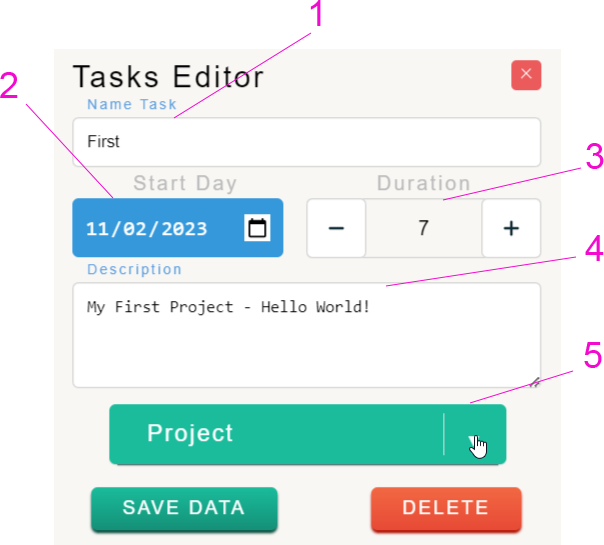
- Project name (specify "First").
- Start date of implementation.
- Set the duration for completion (specify 7 days).
- Briefly describe notes and specifics.
- Specify the type:
- Project;
- Task;
- Finalization Stage Marker;
- Temporarily undefined type (always available to change to any other defined type).
Let's assume this is the first time the dialog is called, in which case we specify the task type as "Project."
After filling in all the fields and parameters of the dialog box, click the "Save Data" button. As a result, a created project will be obtained.
Adding Nested Tasks and Subtasks
Next, create nested tasks in a similar way. Parameters for the first nested data object:
- Name - preparation;
- Start date - the same as for the project;
- Duration - 2 days;
- Type - task.
Parameters for the second nested object:
- Name - execution;
- Start date - the third day of the project;
- Duration - 5 days;
- Type - task.
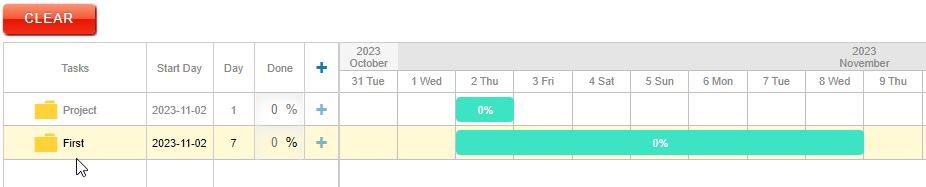
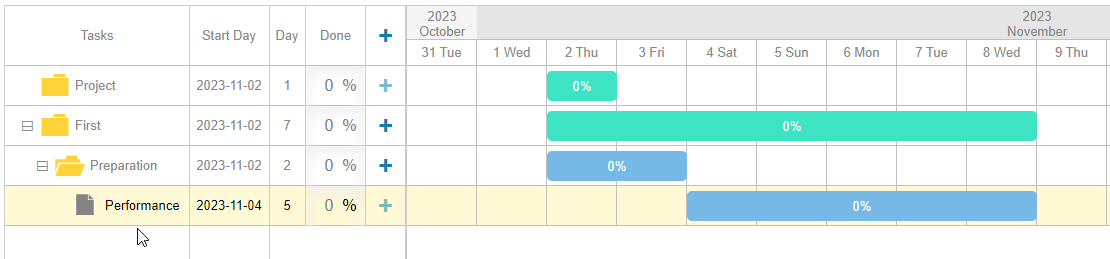
We have created one project and two tasks with different nesting levels:
All created tasks and projects can be edited. To do this, simply double-click with the left mouse button directly on the object in the right part of the Gantt chart or on the corresponding row in the table on the left.
Adding Pointers as in the Data Flow Diagram Online Tool
We can visually present the sequence of task execution in the project using flow arrows. This feature allows us to construct a mind map visualization similar to DFD charts. To do this, place the mouse cursor over any type of object on the right side of the chart. As a result, two marker points appear at the beginning and end of the object.
Next, click the left mouse button on the starting point of the project object and, while holding down the left mouse button, move the cursor to the first nested object, i.e., to its initial first point.
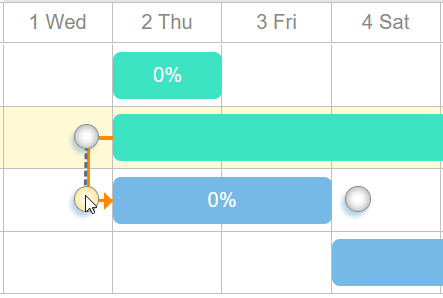
In this way, we have visually linked the two objects, Project and the First task, with an orange arrow.
Repeat the creation of flows with slight changes in actions for the second task.
Click the mouse cursor in the left area of the Gantt Chart on the row of the table where the folder with the first task is located. As a result, the object will again have marker points at the beginning and end.
Click the left mouse button on the last (at the end) marker point of the first task and, while holding down the left mouse button, connect the arrow to the first marker point of the second task.
Next, create the finalization object of the project:
- Name - completion;
- Start date - the last day of the project implementation;
- Duration - 1;
- Type - Final Stage.
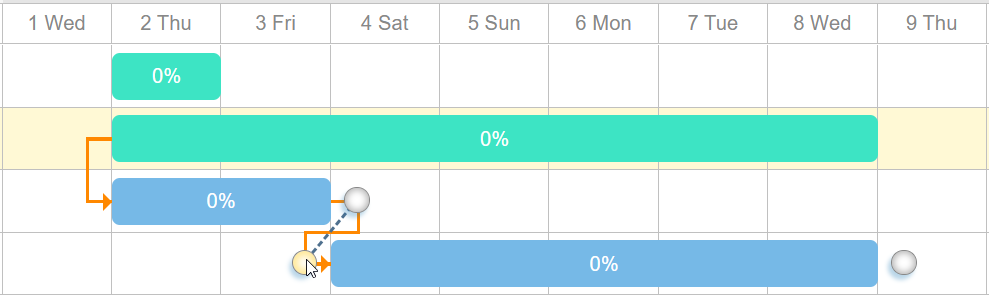
Then connect the final marker point of the last nested object to the first marker point of the finalization stage.
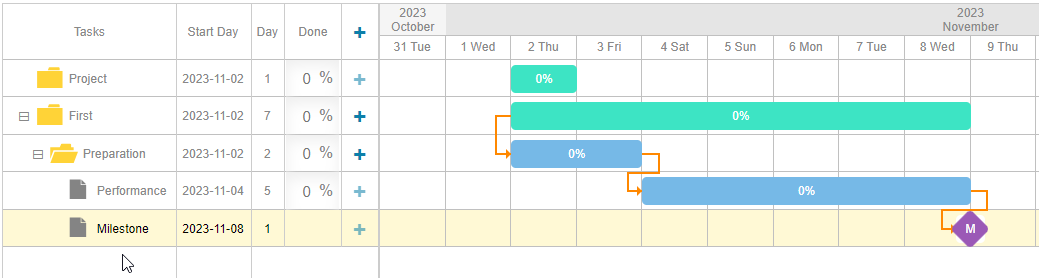
We have created a Data Flow Diagram (DFD) with flow arrows indicating directions of nodes.
Importing and Exporting Data with Flows
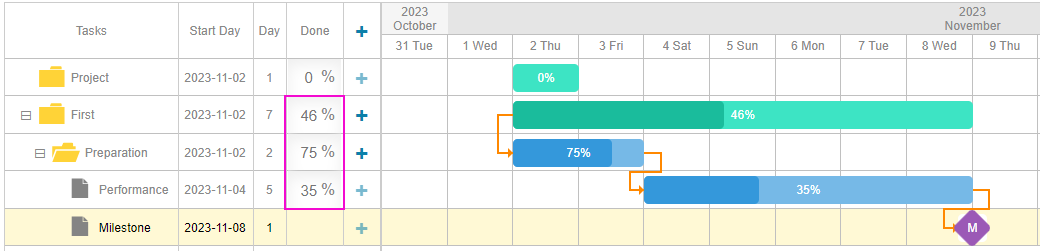
We have a project plan ready; now we need to fill it with percentage values of completion indicators. To do this, in the table on the left side of the chart, enter values from 1 to 100 in the corresponding rows opposite each object on the right side of the chart.
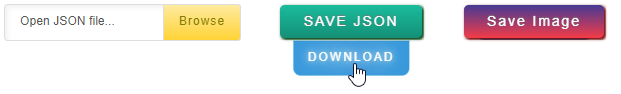
We have graphically constructed the data visualization plan for the "First" project. Now it can be saved in the most popular JSON data exchange format. To do this, click the "SAVE" button at the bottom of the chart, and then select the "DOWNLOAD" option from the drop-down menu. As a result, the browser will save all the work done with the chart in one file.
It's important to note that flow direction arrows are also saved. The hierarchical structure, like a non-relational database, is also preserved.
You can open this JSON file using this constructor for further editing. Use the "Browse" button to upload the saved file to this online constructor.
You can share the saved JSON file with others or import it into other applications for further work. JSON is the most popular data exchange format and is supported by every database application.
Creating an Online Gantt Chart Presentation
If you want to present your project plan and make it accessible for viewing on any program or device, you have the option to save all objects in a popular PNG image format. To do this, click the "Save Image" button in the lower area and then select the "DOWNLOAD" option from the drop-down menu. The browser will save the image file of your project plan in the downloads. Now you can use it in your presentations and share it with friends.
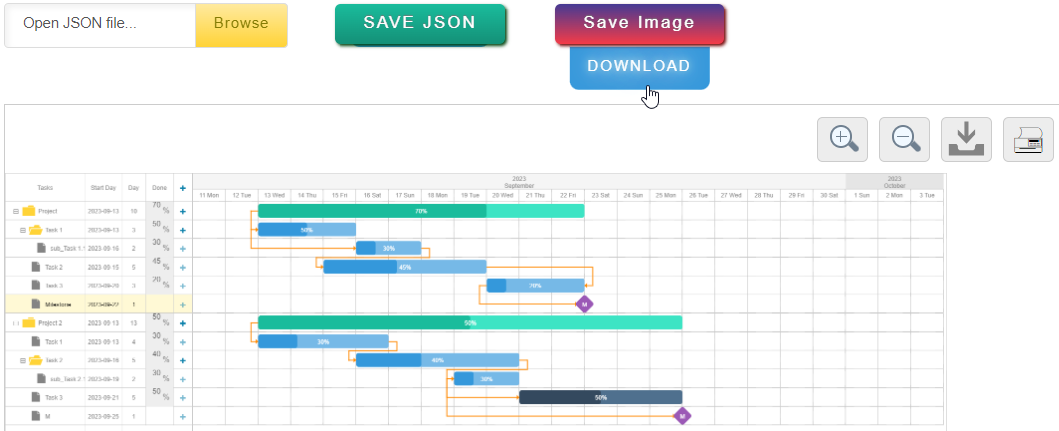
In the presented example, this is a small one-week project consisting of only two tasks. In practice, projects can span for months with many nested tasks. The larger project structure can be viewed with the help of the scroll bar. Thanks to the ability to save the project plan in a graphic format, you can examine the complete picture of a complex plan. After clicking the "Save Image" button, an additional area for scaling the image will appear in the lower area, further enhancing the convenience of analyzing the data structure visualization:
Feel free to use the online constructor to create Gantt charts and publish your project plans in graphical images or JSON data format. Structure, plan, and most importantly, take action. But remember! First, you must win, and only then go into battle.