How to Make $100K Developing Excel Dashboards in 3 Years
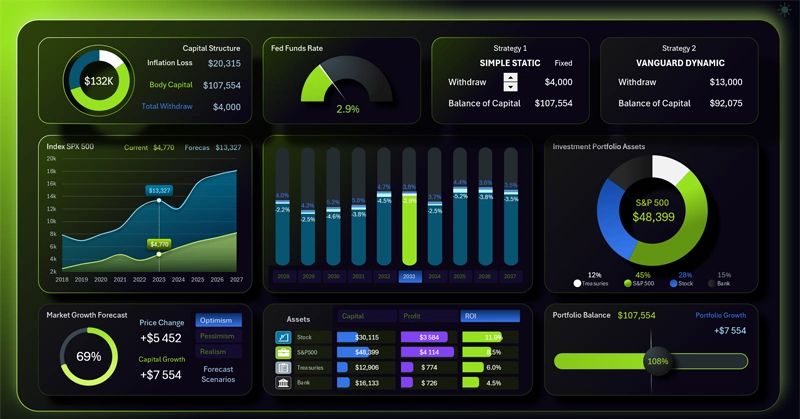
This dashboard helps you design and monitor a system that, with a favorable combination of product quality, organic traffic, and effective personal finance management, can lead to $100,000 in capital within three years.
On this resource you're learning how to develop Excel dashboard templates, but now it's time to capitalize on your knowledge and skills.
Excel Dashboard Developer's Way to Financial Independence
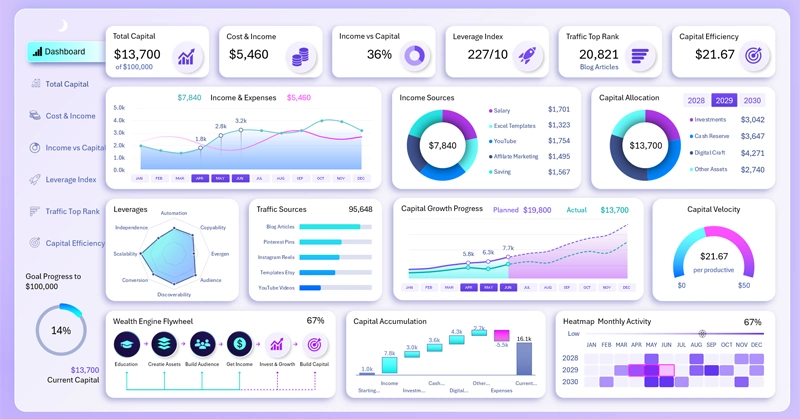
Most personal finance dashboards only help answer two questions:
- How much did I earn?
- How much did I spend?
But almost none of them answer the main question that truly changes your life:
How do you build a strong system capable of multiplying your personal capital several times over?
That's exactly why this dashboard doesn't start with a budget. Not with expenses, and not even with investments. It starts with understanding how a digital craft can turn into a long-term financial asset that generates tangible personal capital.
Throughout history, people have built capital the same way. They mastered a craft, created value, and gradually turned the results of their labor into financial assets. Later, the craft-based system scaled by hiring employees, and a business was formed. But it always started with a craft, and only the tools changed over historical time.
Comparison table of craft directions:
| Profession | What It Produces | When Income Is Received | Financial Asset | Can the Product Work Without the Author? | Scaling Potential |
| Baker | Bread | While baking | Brand | No | Low |
| Concert Musician | Performance | While performing | Music Album | No | Medium |
| Writer | Book | Even after writing | Book Catalog | Yes | High |
| Excel Dashboard Developer | Digital Template | After every publication | Dashboard Template Collection | Yes | High |
The main difference between these professions is not the level of skill.
It lies in whether the value created can keep generating income without the author's or developer's constant involvement.
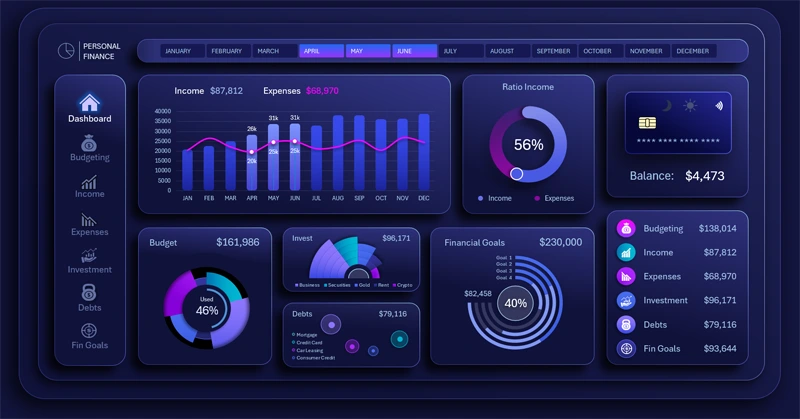
Presentation of a Personal Finance Dashboard template in Excel
Once a digital product is published, it starts working through search engines, YouTube, Pinterest, marketplaces, and the author's own website. The author keeps creating new assets, while previously created ones keep attracting visitors and generating sales.
It's precisely this effect that makes digital products interesting from the standpoint of long-term capital accumulation.
A discussion often comes up on the topic: "What matters more – a businessperson's skills or the direction of the business industry?" If the main goal is speed of results, it's like in horse racing: who matters more, the jockey and their skill, or the horse's qualities? Statistics show that the direction of the business industry leads to bigger financial results faster. Figuratively speaking, the horse matters more than the rider.
Think Not About Sales, But About the System
| Step by Step |
| Learning |
| ↓ |
| Creating Digital Assets |
| ↓ |
| Building an Audience on Social Media |
| ↓ |
| Earning Income from Sales |
| ↓ |
| Investing in Growth |
| ↓ |
| Accumulating Capital |
In this system, a template isn't just a product.
Every new template simultaneously becomes a digital asset such as:
- a new page on the website;
- a new video on YouTube;
- a new Pinterest post;
- a new entry point from Google Search;
- a new digital solutions product.
Each asset increases the potential flow of future clients. In other words, every Excel Template is not just a product, but also a salesperson. A system built on such digital assets is capable of independently generating passive income without the developer's involvement.
Breaking Down the Financial Goal
Suppose your goal is to grow your capital from $10,000 to $100,000 in three years.
With an average price of $30 per Excel dashboard template, reaching this goal on time would require roughly:
- 3,000 sales – 250 sales per month;
- 300,000 organic website visits (at a 1% conversion rate) – about 900 visitors per day;
- around 100 quality digital templates, if each one brings in about 30 sales on average over the whole period.
Of course, this is just an example model. The actual figures will depend on the niche, product quality, traffic quality, conversion rate, and demand.
That's exactly why you need a dashboard where the visualization shows not just the financial outcome, but all the system's intermediate indicators as well. This lets you monitor whether the conditions for reaching the financial goal are being met. Data visualization turns a dream into a real KPI plan. Goals need to be not only ambitious but also achievable, and the dashboard's analysis shows the assessed probability of success.
$100,000 in Capital = Financial Independence
Why was a capital amount of exactly $100,000 used as the example goal for this dashboard? Not because it's some magic number, but because it's the first amount of capital after which investments really start to work. Right now it's very popular to talk about the magic of compound interest, but that magic only works once you've accumulated a critical mass of capital. This has already been described more than once in the books of outstanding investors of our time, Warren Buffett and Charlie Munger. Once you reach that $100,000 amount, you can already secure your financial freedom through the magic of compound interest from traditional investment portfolios of index funds, stocks, and bonds.
Note! In the early years, your wealth isn't created by your investment portfolio. It's created by your craft.
Why This Excel Dashboard Helps
Take a look at our plan for reaching financial independence through developing Excel dashboard templates:
| Stage | Main Goal | Main Result |
| Learning | Master Excel, dashboard design, analytics, SEO, YouTube, and digital marketing | Craft is formed |
| Creating Digital Assets | Build a library of quality templates and supporting content | Digital assets start working on their own |
| Building an Audience on Social Media | Grow organic traffic through YouTube, Google Search, Pinterest, and the website | Steady stream of new visitors |
| Earning Income from Sales | Turn organic traffic into stable digital product sales | Predictable cash flow |
| Investing in Growth | Reinvest income into developing content, tools, and product quality | Accelerated growth of the system |
| Accumulating Capital | Use accumulated cash flow to build personal capital | Achieving the long-term financial goal |
What this kind of dashboard measures. Instead of the usual "Income" and "Expense" categories used for managing personal finances in Excel, it uses indicators that determine the speed of capital growth.
- Target capital.
- Net asset value.
- Required income.
- Required number of orders.
- Website traffic.
- Conversion rate.
- Average order value.
- Number of digital assets created.
- Estimated hourly development rate.
- Monthly growth.
- Forecast for completion of the capital accumulation plan.
This way, the user sees not only the current state, but also understands exactly which element of the system is limiting the achievement of the goal.
In other words, this type of dashboard for managing personal finances in Excel becomes more than just an interactive spreadsheet. It becomes a personal capital management system.
The Main Idea! This Excel personal finance report dashboard wasn't created just to count income and expenses.
It was created to manage the system of capital creation.
Every new template is a new digital asset.
Every new video is another entry point.
Every new article is an additional source of organic traffic.
Over time, these assets start working simultaneously, forming a stable micro-financial system at the scale of personal finances. In this system, capital growth stops being a matter of chance and becomes a consequence of consistently creating value, growing an audience, and disciplined personal finance management.
Why This Idea Should Work
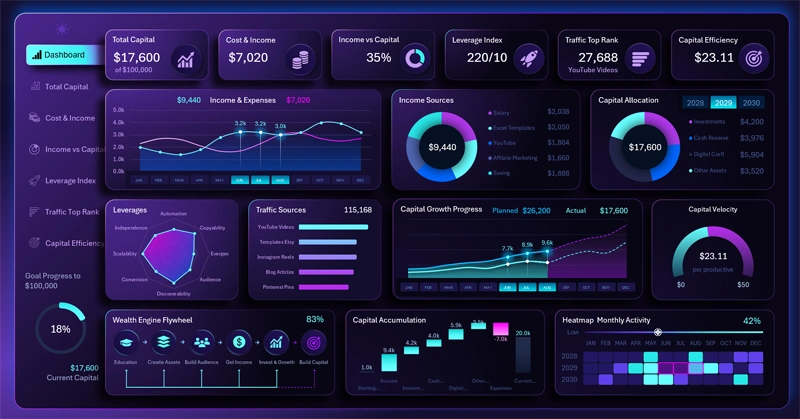
Download Template for Personal Finances of Excel Dashboard Developer
The main factor is the number of digital assets created and the savings rate. Instead of the usual "job" versus "investments" dichotomy, don't underestimate the third category of modern, accessible financial opportunity – "digital assets." These are exactly what become the bridge between craft and capital:
Craft → Digital Assets → Organic Traffic → Sales → Personal Finances → Capital.
This chain best explains why a personal finance dashboard should manage not just expenses and investments, but the entire system as a whole.
The autonomous, automated capabilities of digital assets to independently generate profit without the developer's involvement is the most underrated potential source of rapid personal financial capital accumulation.
Self-Working Potential (SWS) is the ability of a digital asset to independently create economic value after development is complete, through automated audience acquisition, conversion into sales, and repeated monetization via existing digital infrastructure.
It's precisely a high Self-Working Potential (SWS) score that sets digital assets apart from traditional craft. The longer an asset is able to independently attract clients and generate income, the higher the contribution of every hour spent developing an Excel template to capital accumulation. This is well worth tracking on an interactive dashboard:
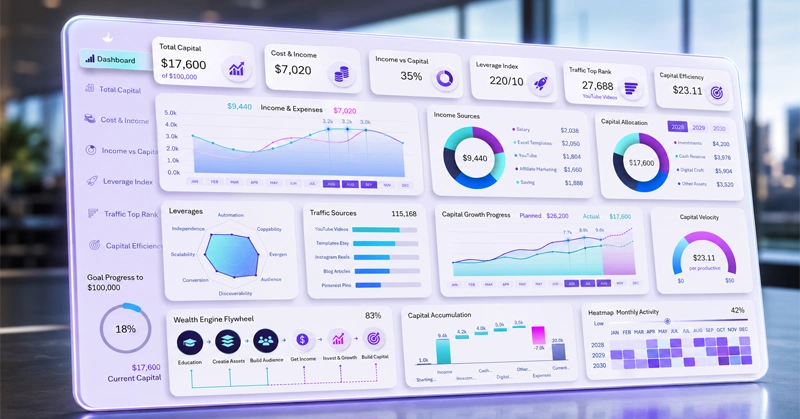
Download the dashboard for fast personal capital accumulation in Excel 
The purpose of this dashboard isn't to get rich. Its main goal is to build a system in which every new interactive data visualization template in Excel becomes one more digital asset. Each such asset generates passive income like an employee would. Every hour invested in learning and developing dashboards in Excel grows your personal financial capital, and every month brings you significantly closer to financial independence.
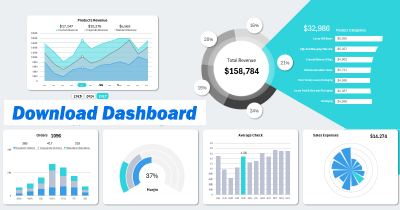
Data Visualization Charts for Interactive Report Creation in Excel.
Dashboard Templates