Download reports with formulas and ready-made calculations in Excel
Free download ready-made examples of interactive dashboards with a detailed description and instructions for use.Financial models examples
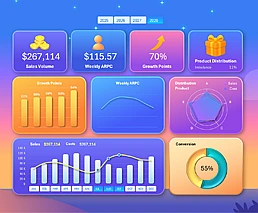 Example of Excel interactive sales report with gamification.
Download the Excel dashboard template with gamification elements in data visualization design. Attractive design and convenient settings make working with reports interesting and efficient.
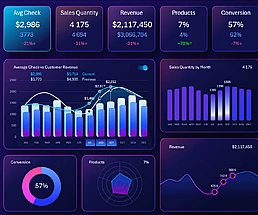 Excel dashboard for comparing monthly metrics by year.
Interactive dashboard for comparing monthly metrics with last year’s results in Excel. Comparative analysis of revenue, sales, average check, and conversion. Download the ready-made template.
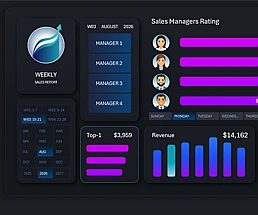 Excel Dashboard Template for Weekly Sales Team Meetings.
Download the dashboard template to present results and forecast goal achievement for the sales team. Identify key sales patterns related to days of the week.
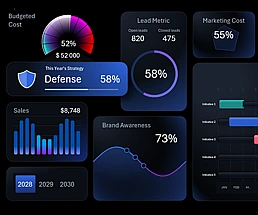 Excel Dashboard for Visualizing Brand Marketing Strategy.
Download the dashboard template for developing and managing marketing strategies aimed at increasing brand awareness. Make the most of Excel’s visualization capabilities to achieve top results with maximum satisfaction.
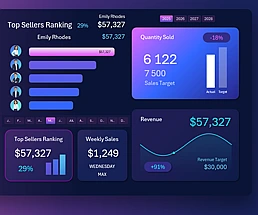 Dashboard for Improving Sales Team Performance in Excel.
Download a beautiful dashboard to analyze and increase sales team performance. Core sales techniques to help sell more. Why plan product quantity if revenue is already tracked?
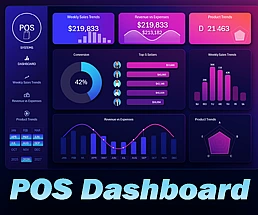 Excel Dashboard for POS System Salesperson Reports.
Free Download a beautiful dashboard to analyze sales in retail locations with the ability to segment data by salesperson using slicer filters.
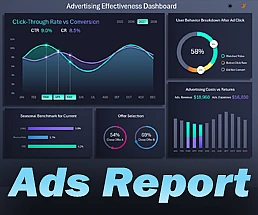 Interactive Excel Dashboard for Advertising Report.
Download a beautiful dashboard to analyze and monitor the efficiency of financial spending during your advertising campaign. A summary report on ad spend to boost sales.
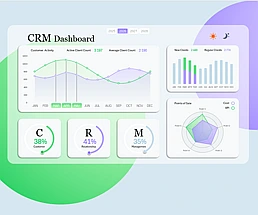 Beautiful Excel Dashboard template for CRM system reports.
Download a beautiful free dashboard template for CRM systems. See how you can expand software reports with new interactive data visualizations using Excel.
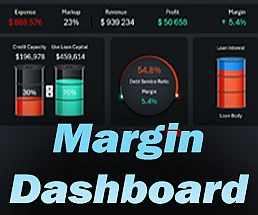 Excel Dashboard to Calculate Impact of Credit on Margin.
Download the mini dashboard template for an interactive presentation of credit usage in working capital. Explore the correlation between debt load and margin at different product markups.
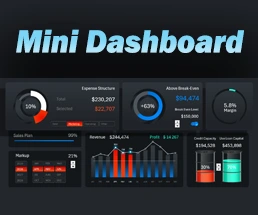 Quick credit usage analysis for small business in Excel.
Download the mini dashboard to visualize only the most critical key performance indicators for managing credit capital in small business working capital.
Excel Dashboard Templates for Business

Data Visualization Charts for Interactive Report Creation in Excel.
Dashboard Templates