Download examples of ready-made templates for interactive reports in Excel
Ready-made solutions and examples for creating interactive documents or reports with formulas and functions for calculating input values.Download document and report templates
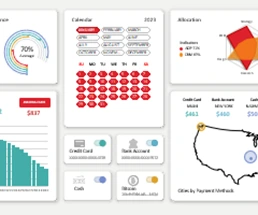 Excel calendar template for data visualization download.
A tutorial on creating a calendar template for dashboards with a step-by-step description. The lesson is accompanied by a file with an example and a ready-made solution for an interactive calendar.
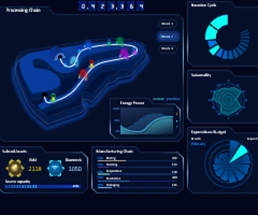 Excel Charting with gamification element Download Dashboard.
Template with an example of a universal dashboard for the presentation of data visualization of the business processes of the production chain with gamification elements.
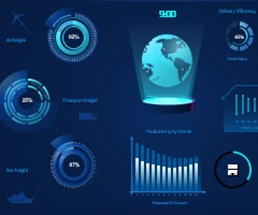 Excel Dashboard Template planet same day logistic Download.
Download example dashboard for a spectacular presentation of logistical indicators. Infographic animation elements are applied. Assembling beautiful diagrams.
 How to make World Map Chart presentation in Excel template.
Step-by-step instructions for creating an infographic with an animation effect. A lesson with examples of how to make interesting data visualization in Excel. Download example template.
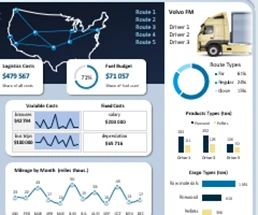
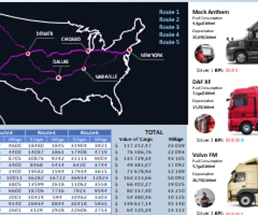 How to make a Map Chart for logistics management in Excel.
Download logistics management performance report presentation. How to create your interactive Map Chart with logistics supply chain routing.
 Logistics Tracking Excel Spreadsheet Free Download.
Download report template for logistics management performance evaluation with data visualization. How to create a TOR for the development of the dashboard for the business?
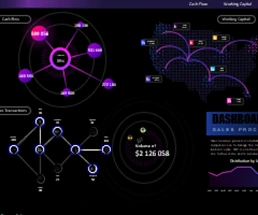 Beautiful dashboard for analyzing sales processes in Excel.
Free download dashboard template with stylish design for sales report presentation. An example of Excel's data visualization design capabilities.
 Example of Cash Flow visual analysis on Combo Chart Excel.
Download beautiful presentation for cash flow circulation analysis. How to make a combo chart in Excel from a composition of different types?
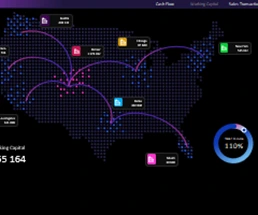 Example of creating simple interactive Map Chart in Excel.
Simple principles of creating interactive charts with maps to present reports with data visualization. Free template download with an example.
 Payment Processing Transactions Scheme New Chart in Excel.
Download a sample template for a new homemade Excel chart type with data visualization animations and interactive features for narrowly focused tasks.
Excel Dashboard Templates for Business

Data Visualization Charts for Interactive Report Creation in Excel.
Dashboard Templates