Download examples of using formulas and functions in Excel
Ready samples of electrical spreadsheet abilities in the economic and financial breakdown of companies.Spreadsheet capabilities
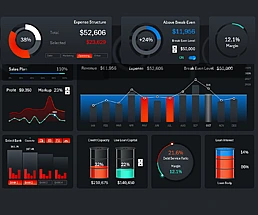 Excel Dashboard for Small Business Credit Impact analysis.
Download the dashboard to track the influence of borrowed capital on the scalability and financial stability of your small business. Credit Impact analysis in Excel.
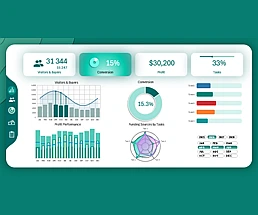 Excel dashboard for managing business projects from tablet.
Download the dashboard template for tablet use. See how easy and convenient it is to manage a business project with interactive and visual reports.
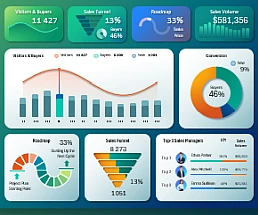 Beautiful Sales Project Management Dashboard in Excel.
Download a beautiful Excel dashboard for managing sales projects. Its user-friendly structure, clear logic, and modern design make it an ideal tool for salespeople, analysts, and project managers.
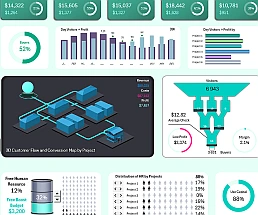 3D Dashboard for Project Management in Excel Free Download.
A useful template for effective project management with impressive and functional data visualization. An example of how to create a beautiful dashboard in Excel.
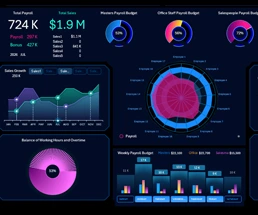 Download Excel Payroll Dashboard for Small Business.
An interactive report template for analyzing employee payroll in a small business. Visualization of KPI indicators for the performance quality of three staff categories.
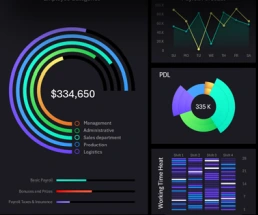
 Employee performance Dashboard Excel template free download.
Interactive visual report template for evaluating employee efficiency in Excel. A beautiful presentation for HR specialists and team managers with useful data segmentation features.
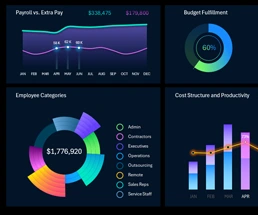
 Payroll Report Template with Example for Salary Summary.
Download a dashboard template for analyzing payroll summary data in an interactive format. See an example of how to create a visually appealing payroll report for an interactive presentation in Excel.
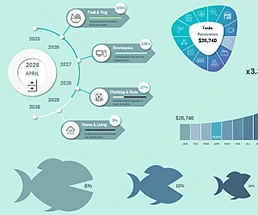
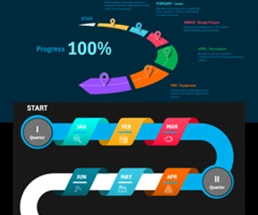 Download an Interactive Developer Roadmap Charts in Excel.
Download the infographic template for project creation or development with interactive data visualization. How to create a stunning developer roadmap—two examples.
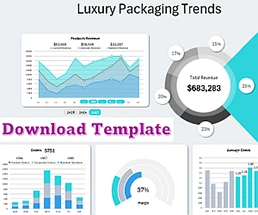 Excel Dashboard for Small Businesses in Premium Packaging.
Download the dashboard template for managing a small business in the luxury packaging industry. Your small yet prestigious and high-margin business, tailored to modern market conditions.
 Project Management Dashboard in Excel with Infographics.
Download the business process management dashboard template in Excel. An interactive infographic with a dynamic gamified design for practical business scaling tasks.
Excel Dashboard Templates for Business

Data Visualization Charts for Interactive Report Creation in Excel.
Dashboard Templates