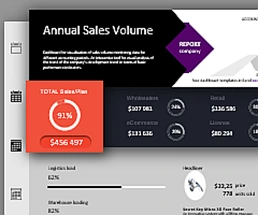
Comprehensive Dashboard Report Download in Excel Template
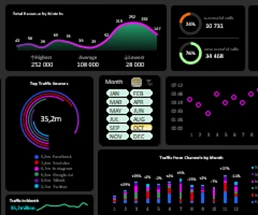
The modern world is driven by data. Effective analysis and presentation of sales reports are crucial for making informed business decisions. The sales dashboard templates in Excel are designed to provide a reliable solution with simple and accurate visualization and analysis of your sales data. Interactive dashboard templates not only enhance reporting capabilities but also offer a visually appealing presentation that can be tailored to your specific needs through visual analysis.Dashboard report of sales download in Excel
 Excel Comparative and Correlation analysis of sales download.
Download a dashboard for comparative and correlation analysis of marketing and sales results. How do you friend marketing and sales with an Excel report?
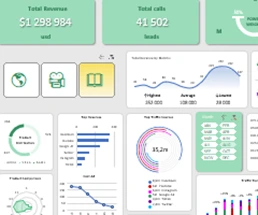 Analysis Sale of learning Courses Excel Dashboard Download.
Download dashboard for correlation analysis sales training course development data visualization in Excel. Interactive report presentation.
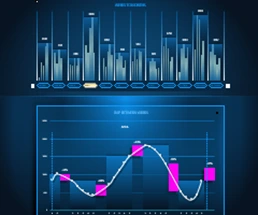
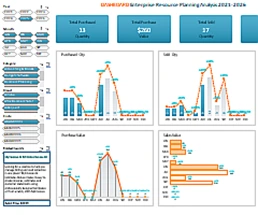 Financial analytics IT business for enterprise sales in Excel.
Download a data visualization example for financial sales analysis with extensive features: segmentation, filtering, sampling and value searching.
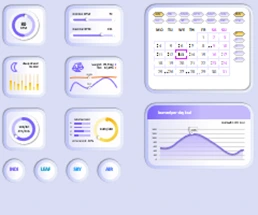 Fitness calendar with weather analysis download template in Excel.
Dashboard with visualization of data about the weather and the physical condition of the user. A project of a fitness application for analyzing the correlation of weather and body condition indicators during physical exertion during training.
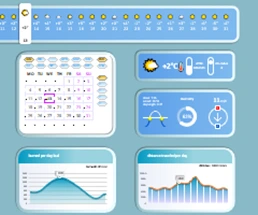 Weather Analysis with Fitness Calendar in Excel Template.
Download the weather and fitness calendar dashboard for analyzing correlations and adjusting values to improve workout efficiency. The impact of weather conditions on the body during physical exertion.
 Dashboard for gadget store sales report download in Excel.
Download a dashboard for a gadget store. Sales report presentation template with data visualization to analyze the return on investment invested in the business.
 Gap Analysis template Excel with Chart free download.
Strategic Gap Analysis in Financial Performance Statistics. Interactive data visualization with design elements for practical applications.
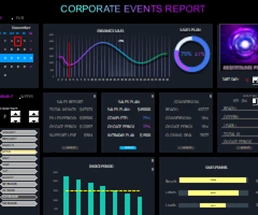 Corporate events and execution of KPI plans in Excel.
An example of the data visualization for the report presentation and visual analysis of the correlation between the implementation of corporate events and the fulfillment of plans by key performance indicators (KPIs).
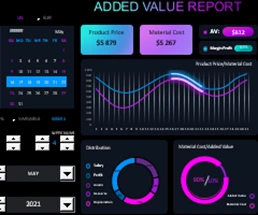 Added value excel dashboard example free download.
Download interactive presentation of enterprise value added financial measures. What is value added best example report.
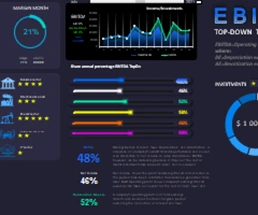 EBITDA Formula Calculation Excel Spreadsheet Template on Chart.
Download a dashboard template to visualize EBITDA calculation using different bottom-up and top-down calculation formulas. Presentation of EBITDA indicators on an interactive dashboard.
Excel Dashboard Templates for Business

Data Visualization Charts for Interactive Report Creation in Excel.
Dashboard Templates