Download beautiful data visualization templates in Excel
Presentation-style report templates with dynamic metrics graphs. Download data visualization for spreadsheets. Lessons on creating presentations in Excel.Collection of visualizations for dashboards
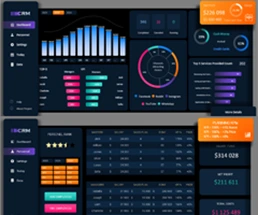 Excel CRM Dashboard Template for Small Businesses.
Grow your small business with our Excel CRM dashboard template! Download free pivot chart templates and watch your business thrive. What to choose Excel CRM or ERP system with CRM?
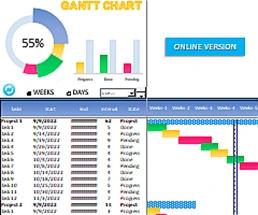 Gantt Chart Template for Project Management in Excel.
An example of creating a Gantt chart using Excel spreadsheets. Free Download a template with dynamic charts. How to build a calendar of plans?
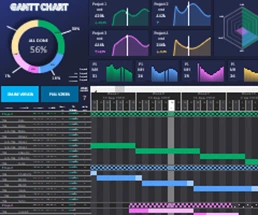 Where and How to Use Gantt Charts in Excel download.
The example demonstrates what ample opportunities MS Excel provides for creating a Gantt chart even without using macros. A short video presentation and a file with a finished example.
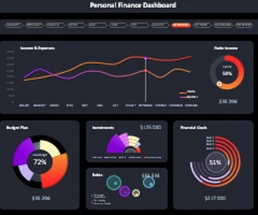 Personal financial planning Dashboard template on Excel sheets.
Lists of the most popular fixed and non-fixed expenses in personal finance to organize the application. Tips for creating data visualizations for your family budget.
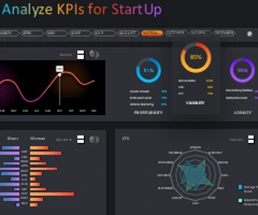 How to analyze or present KPI for startup projects in Excel.
Example of how to analyze and present a successful business project. The most important KPIs for a startup. Download KPI report template for presentation.
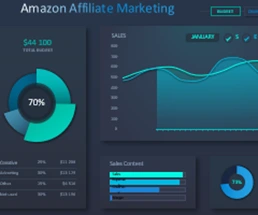 Amazon Affiliate Expenses Tracker Template Download.
Download a dashboard template for analyzing online sales by key indicators. Everything you need to know about Amazon Affiliate Marketing for a beginner.
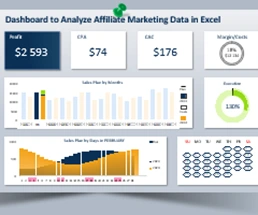
 Comparative analysis of sales charts in Excel Download.
An example of a template for a visual comparative analysis of sales on a spaghetti-type chart for two selected groups of indicator values - free to download.
 How to make Pie Chart more than 100 percent in Excel.
An interesting idea is how to create charts for indicators more than 100% or 200% and above. Step-by-step instructions with a file example of the finished result - download.
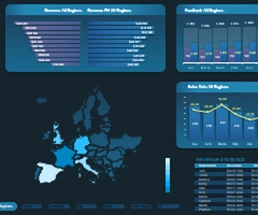 How to Create a Heat Map in Excel template free download.
Development of an interactive heat map of the USA and the European Union for data visualization in Excel. Download a ready-made dashboard template with figures of US states and EU countries.
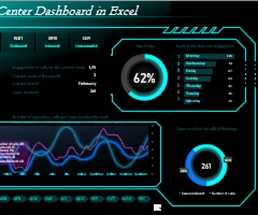 How to make a beautiful Pie Chart for a dashboard in Excel.
Step-by-step instructions for assembling a combo chart with a color scheme. Download a ready-made example with a dashboard template for a call center presentation.
Excel Dashboard Templates for Business

Data Visualization Charts for Interactive Report Creation in Excel.
Dashboard Templates