Excel Dashboards Made Simple and Powerful
Excel dashboards have become a favorite of mid-to-high level managers and even business owners. They are used to help sort that data, to get a visual of key metrics and to immediately see any flash trends or issues. The best part? You don’t have to be an expert to create one — focus on the things that are important but do them the right way, clearly.
Excel Dashboards can help you make faster business decisions
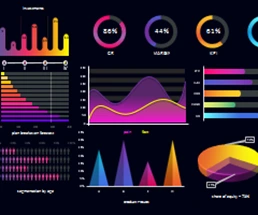 Dashboard for diversification analysis and test of business niches in Excel
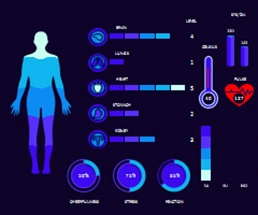 Medical Dashboard for analysis of patient history in Excel
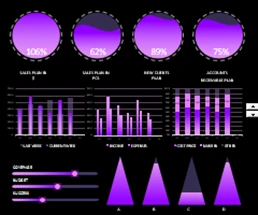 Comparative analysis of sales by day of the week in Excel
 5 beautiful ideas for creating interactive infographics Excel
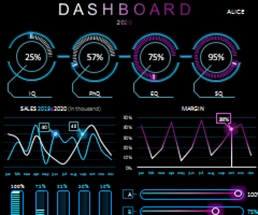 Business Intelligence Dashboard for manager and sales in Excel
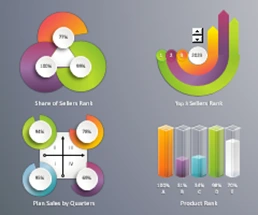 Dashboard for analyzing sales ranking factors in Excel
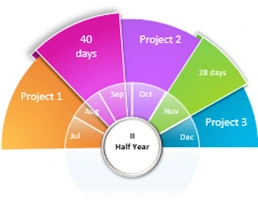 Beautiful chart for presentation of reports in Excel
 Download Cafe Products Sales Analysis in Excel template
 Chart with data visualization for laboratory work in Excel
 Petal Pie Сhart and benchmarking in Excel
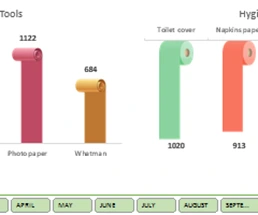 Shapes in charts and graphs for report presentation in Excel
 Monthly Sales Close Plan Template on Excel Chart
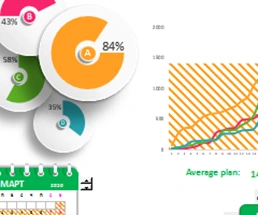 Excel Sales Report Template on monthly and daily Chart
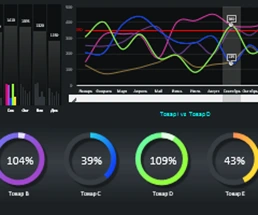 Advanced sales comparative analysis products download in Excel
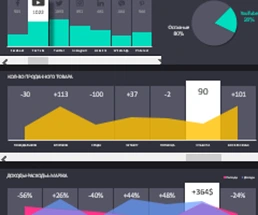 Metro style dashboard design for charts in Excel
 Benchmark sales by year on a dashboard report in Excel
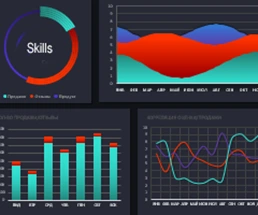 Dashboard for visual analysis of test results in Excel
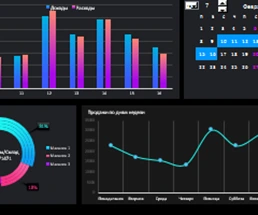 How to make an interactive calendar in Excel template download
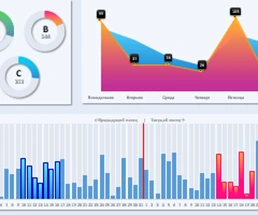 Benchmarking sales with data visualization in Excel
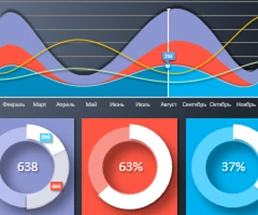 Chart report on financial results of company download in Excel
Excel Dashboard Templates for Business

Data Visualization Charts for Interactive Report Creation in Excel.
Dashboard Templates