Download interactive dashboards for small business in Excel
Data visualization enables efficient control and management of business processes. Even with basic tools like Excel, a wide range of needs for developing and using dashboards for small businesses can be met. Pivot tables unlock extensive interactive features without requiring macros or programming skills! Anyone can master the art of data visualization in Excel.
Templates for interactive dashboards for data visualization
 Excel Comparative and Correlation analysis of sales download
 Analysis Sale of learning Courses Excel Dashboard Download
 Financial analytics IT business for enterprise sales in Excel
 Fitness calendar with weather analysis download template in Excel
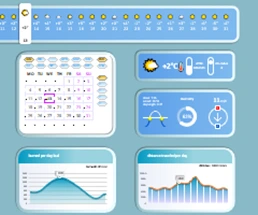 Weather Analysis with Fitness Calendar in Excel Template
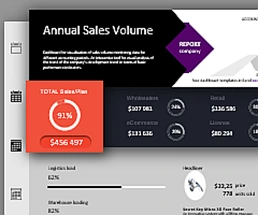 Dashboard for gadget store sales report download in Excel
 Gap Analysis template Excel with Chart free download
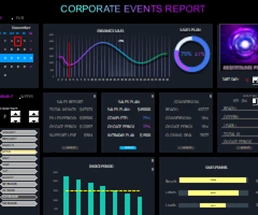 Corporate events and execution of KPI plans in Excel
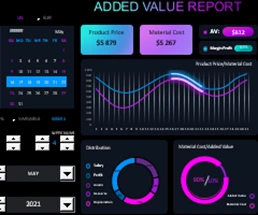 Added value excel dashboard example free download
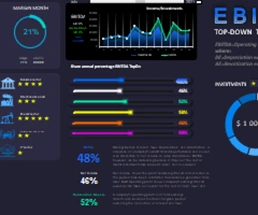 EBITDA Formula Calculation Excel Spreadsheet Template on Chart
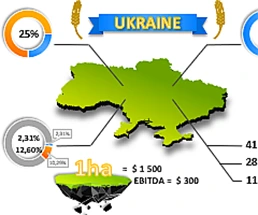 Excel Presentation of cost of arable land in Ukrainian
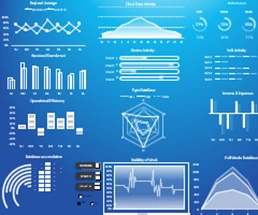 Cloud Audit Dashboard download free in Excel
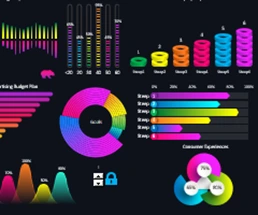 Beautiful dashboard for brand strength analysis in Excel
 Create Infographic Charts from Excel data template
 Data rating chart for visualization download in Excel
 Ranking chart for data visualization download in Excel
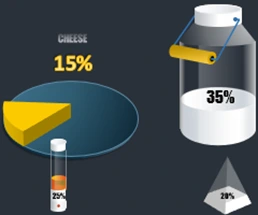 3D infographics for Excel presentation cheese sales report
 Easy example of 3D Pie chart with value than 100% in Excel
 Excel Comparison Chart Template with Examples free download
 Associative techniques for visualizing data sampling in Excel
Excel Dashboard Templates for Business

Data Visualization Charts for Interactive Report Creation in Excel.
Dashboard Templates