Analysis of the data in Excel using the functions and computational tools
Perform analysis of data in tables using functions, formulas and built-in standard tools, as well as practical application of extensible settings for finding solutions.Data analysis and the search for solutions
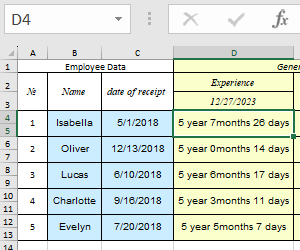 How to Calculate Average Wages for Vacation in Excel.
Download examples of automatic calculation of accrual of vacation pay and the number of vacation days. A ready-made example of calculating average earnings and vacation pay for full and partial periods.
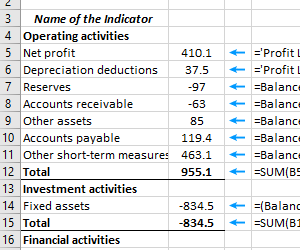 Creating Financial Models in Excel for selling a business.
How to build a financial model when buying a business: drawing up a cash flow report, an algorithm for calculating financial ratios for analyzing business performance and calculating key indicators using a ready-made example.
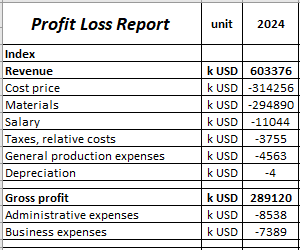 Economic Efficiency Coefficient of Company in Excel.
Calculation of indicators of financial stability, liquidity, profitability and other coefficients of economic efficiency of an enterprise: formulas, description of values.
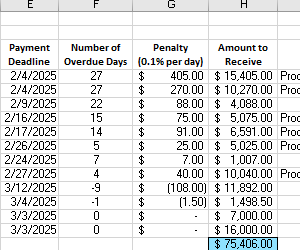 Analysis of Accounts Receivable financing in Excel.
We identify clients whose debt amount is greater than legal costs. How to calculate the number of days overdue by the client and penalties for this period? Calculating the total amount owed.
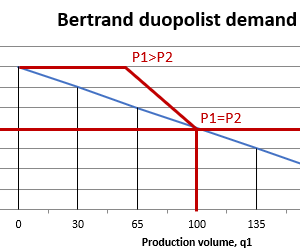 Bertrand Model Example in Excel with Charts Download.
The function of the Bertrand model is to show the strategic behavior of duopolists in the market of similar goods. Their reactions are also called a price war, that is, dumping, because the constant for a company is the competitor’s price.
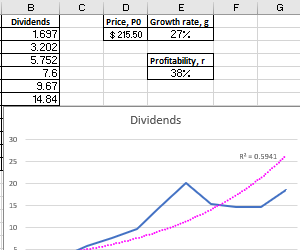 Gordon Formula for Evaluating Future Stock Returns.
The Gordon model can be used to estimate the value of investment objects and equity in Excel. A model for calculating future returns on stocks and businesses.
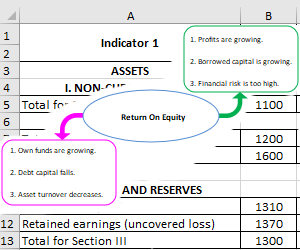 Formula to calculate Return On Equity in Excel.
Return on equity: balance sheet formula. ROE is an important criterion for assessing the investment attractiveness of an enterprise. Formulas for calculating the profitability ratio.
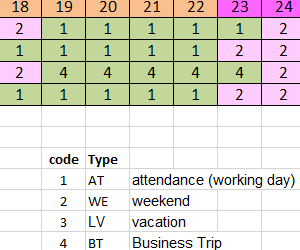 Timekeeping Spreadsheet Tracking in Excel - Free Download.
Instructions for creating and setting up a timesheet for recording working hours with the ability to auto-fill cells with data. Best Timesheet in Excel.
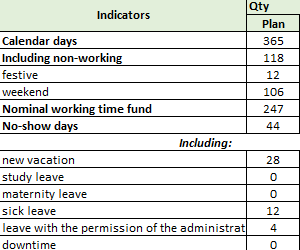 Work-Life Balance of Employees Report in Excel Download.
How to create a working time balance in Excel for the entire enterprise and for one average worker? Calculation of balance sheet components, comparison of standard and actual indicators.
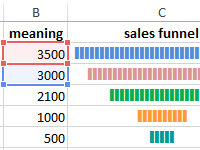 Chart of funnel sales in Excel download for free.
How to make the sales funnel in Excel using formulas, the SmartArt drawing and the Charts tool. The description of different methods with step-by-step instructions and illustrations.
